Sydney Transit Intelligence Platform
End-to-end lakehouse pipeline that turns live Transport for NSW feeds into Sydney rail reliability insights with dbt and Tableau.
- Role
- Solo project / independent build
- Stack
- Python, Databricks, Delta Lake, dbt, SQL, Tableau
- Scope
- 7 Bronze tables · 8 Gold marts · 31 dbt tests
- Source
- View on GitHub
1.2M
Scheduled stop-times reconciled against
15 min
Live ingestion schedule
31
Automated dbt tests
8
Gold marts, 1 incremental fact
How it came together.
- 01
The problem
Transport for NSW publishes a live GTFS-Realtime feed, but not a consolidated, historical, analysis-ready reliability dataset. The realtime feed is a snapshot that only becomes useful once it is captured over time and reconciled against the published schedule: which trip was late, by how much, and what else was happening at the time. That reconciliation is the actual problem this project solves.
- 02
The pipeline
Python ingests the GTFS static and GTFS-Realtime feeds into a Databricks Unity Catalog volume, which loads 7 Bronze Delta tables on a 15-minute schedule, including 1.2 million scheduled stop-times to reconcile the live feed against. dbt Core then builds 8 staging models, 1 intermediate reconciliation model and 8 Gold marts, including 1 incremental fact table, with 31 automated tests on top.
- 03
Quality and CI/CD
The dbt tests caught 3 real data issues on real data, among them a REPLACEMENT schedule-relationship value that wasn't in the accepted list, and a uniqueness violation across 1,348 rows from TfNSW reporting `stop_sequence=0` for every stop on some intercity trips. GitHub Actions runs ruff and pytest on every push and a dbt build against an isolated schema on every dbt pull request, and the dbt documentation is deployed automatically.
- 04
The finding
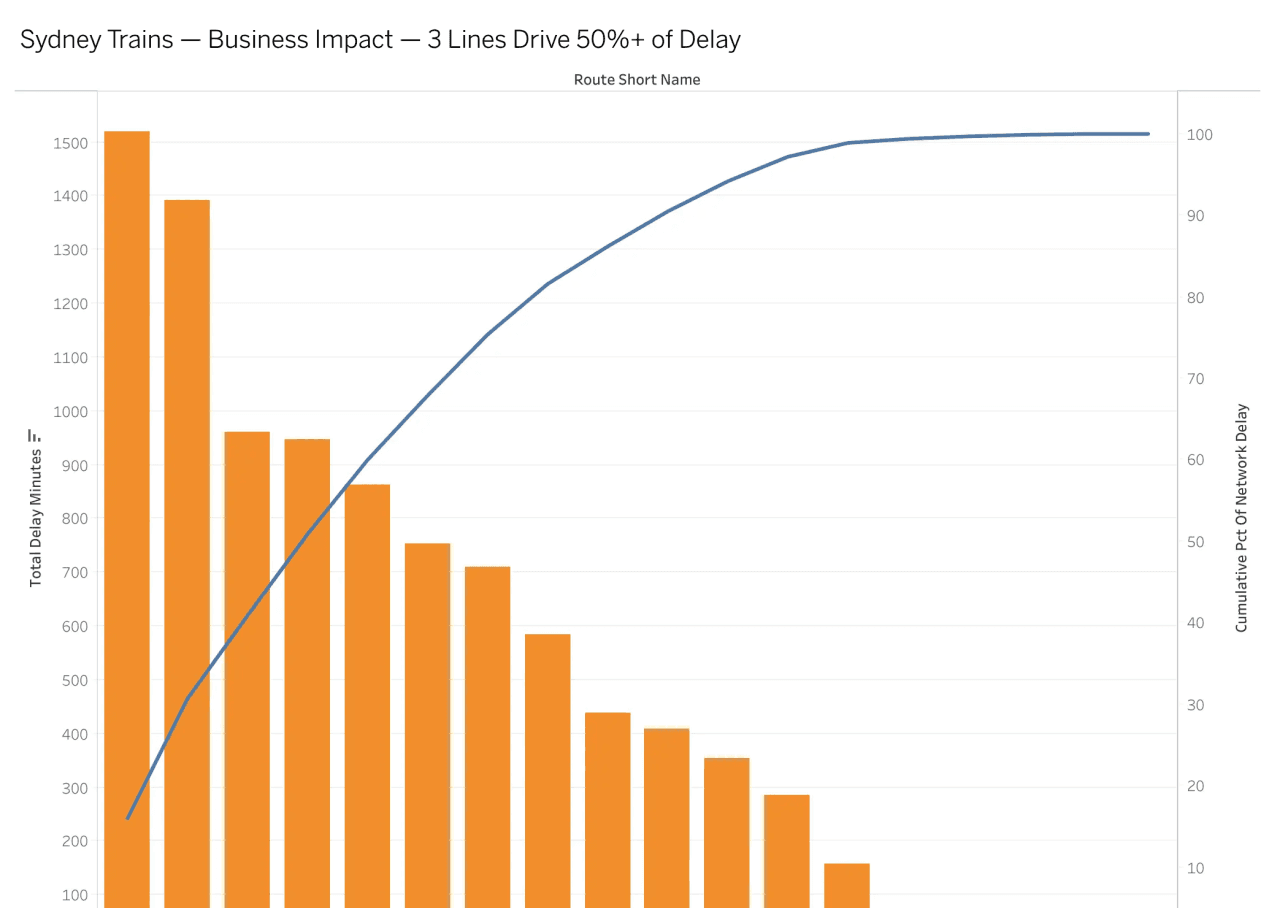
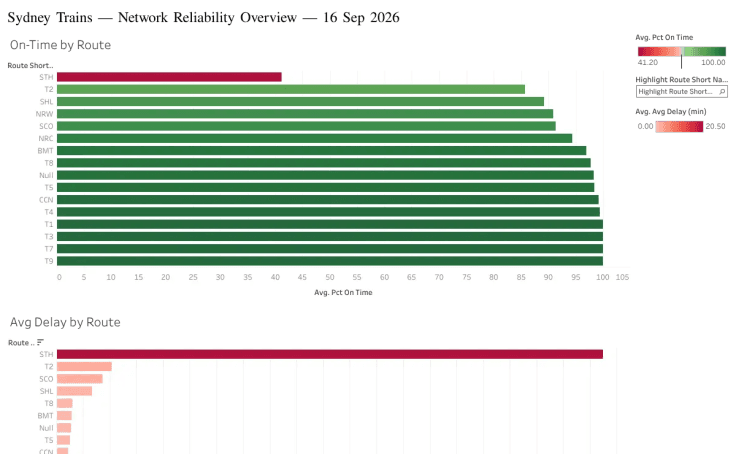
The Gold layer answers the question a network performance team would ask first: where should limited attention go? It shows that a small number of rail lines account for a disproportionate share of network delay, and a second mart compares observed delay during active service alerts against each route's own baseline. Both surface through 2 Tableau Public dashboards, and both are recomputed on every pipeline run as more history accumulates.
What it produced.
01 figures
- Python
- Databricks
- Delta Lake
- dbt
- SQL
- Tableau
Have a similar problem to solve?Let's talk it through.
I'm looking for a data analyst role in Sydney, and I have full working rights here. If something here looks like the work you need doing, get in touch.
Open to opportunitiesSydney, Australia