Sydney Airbnb Guest Satisfaction Classifier
Supervised ML pipeline that finds what actually drives guest satisfaction while debunking a misleading signal.
- Role
- Solo project / independent build
- Stack
- Python, scikit-learn, XGBoost, SHAP
- Scope
- 17,730 Sydney listings · Sep 2025 scrape
- Source
- View on GitHub
17,730
Sydney listings analysed
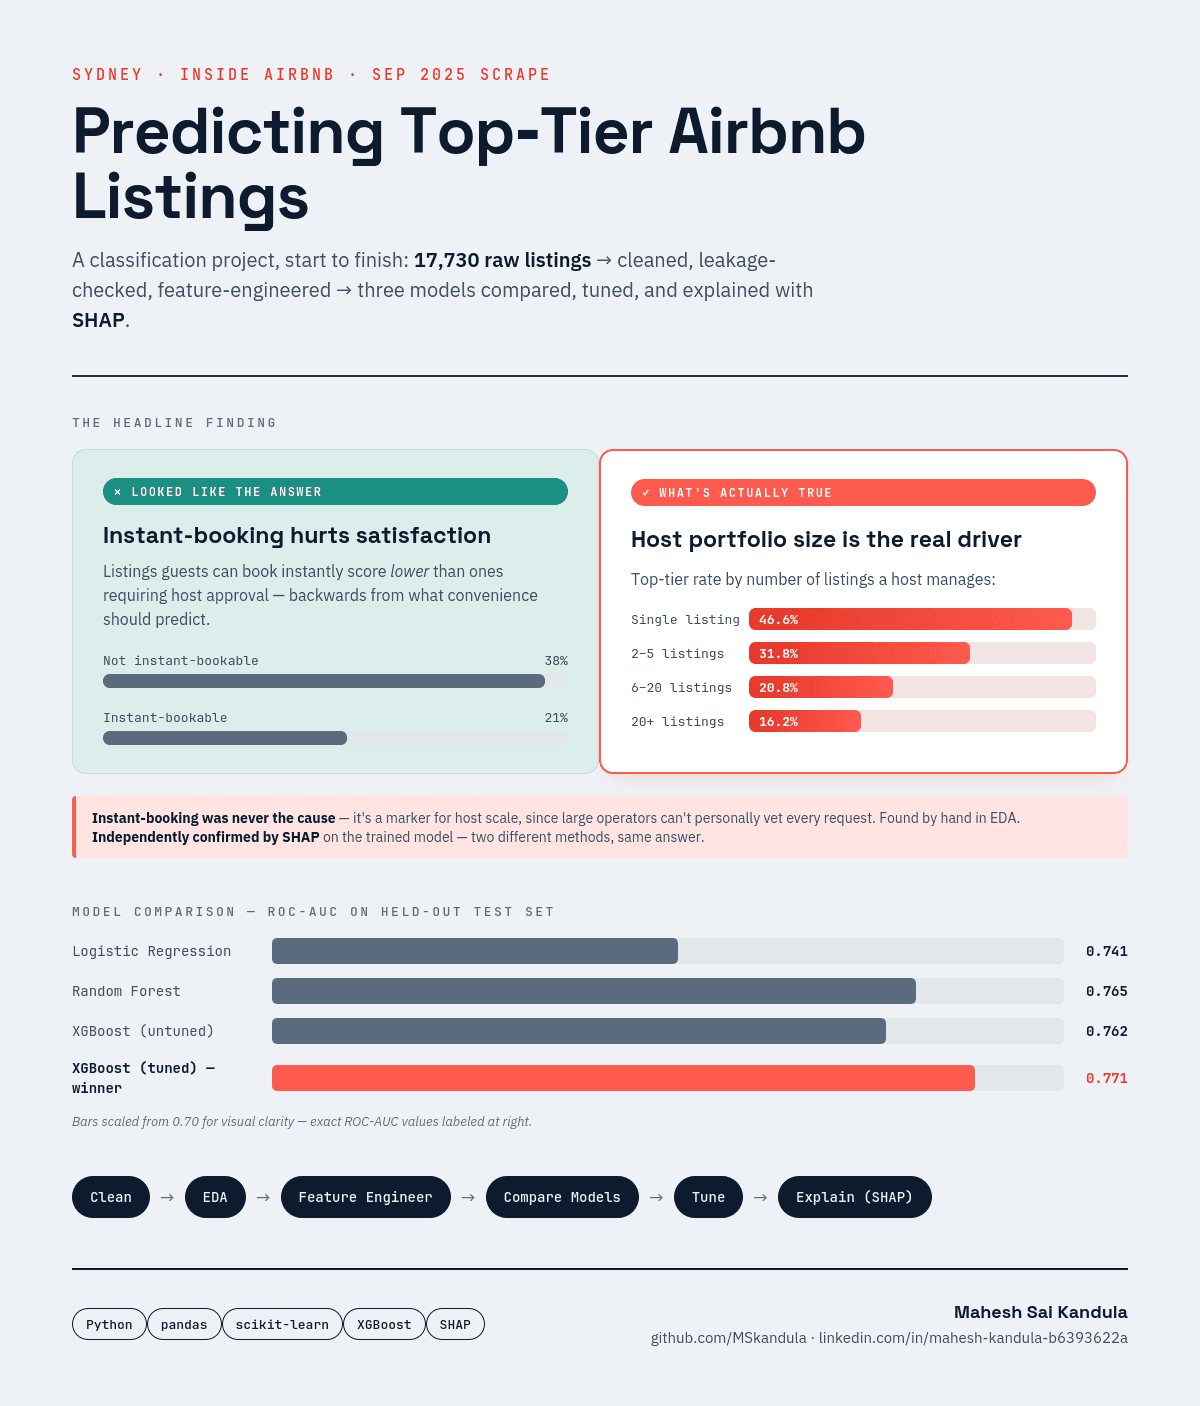
0.771
ROC-AUC on held-out test data
3
Model families compared
46.6% / 16.2%
Top-tier rate, 1-listing vs 20+ hosts
How it came together.
- 01
The question
The question I set out to answer sounds simple: what makes an Airbnb listing top-tier? But I wanted to answer it honestly, without the usual shortcuts. I built an end-to-end supervised ML pipeline on Inside Airbnb's Sydney dataset (17,730 listings, Sep 2025 scrape), classifying listings as top-tier vs. standard. Rather than picking an arbitrary percentile, I defined the target (review_scores_rating ≥ 4.9 with ≥ 5 reviews) through class-balance testing so the label meant something.
- 02
The blocker
Early on I hit a wall: the price column was 100% null, and I verified that at both the listing and calendar level. Instead of dropping the dataset, I pivoted the feature strategy to host- and property-behaviour signals and documented the sourcing decision, because a real project rarely gives you the feature you expected.
- 03
Feature engineering
Feature engineering was where the honesty mattered. I derived host tenure from signup dates, parsed amenities into counts and binary flags, and recovered bathrooms via regex, while deliberately excluding leakage columns like review sub-scores and host_is_superhost that would have let the model cheat. I compared Logistic Regression, Random Forest, and XGBoost, then tuned the winner with RandomizedSearchCV (3-fold CV) to reach ROC-AUC 0.771 on held-out test data.
- 04
The finding
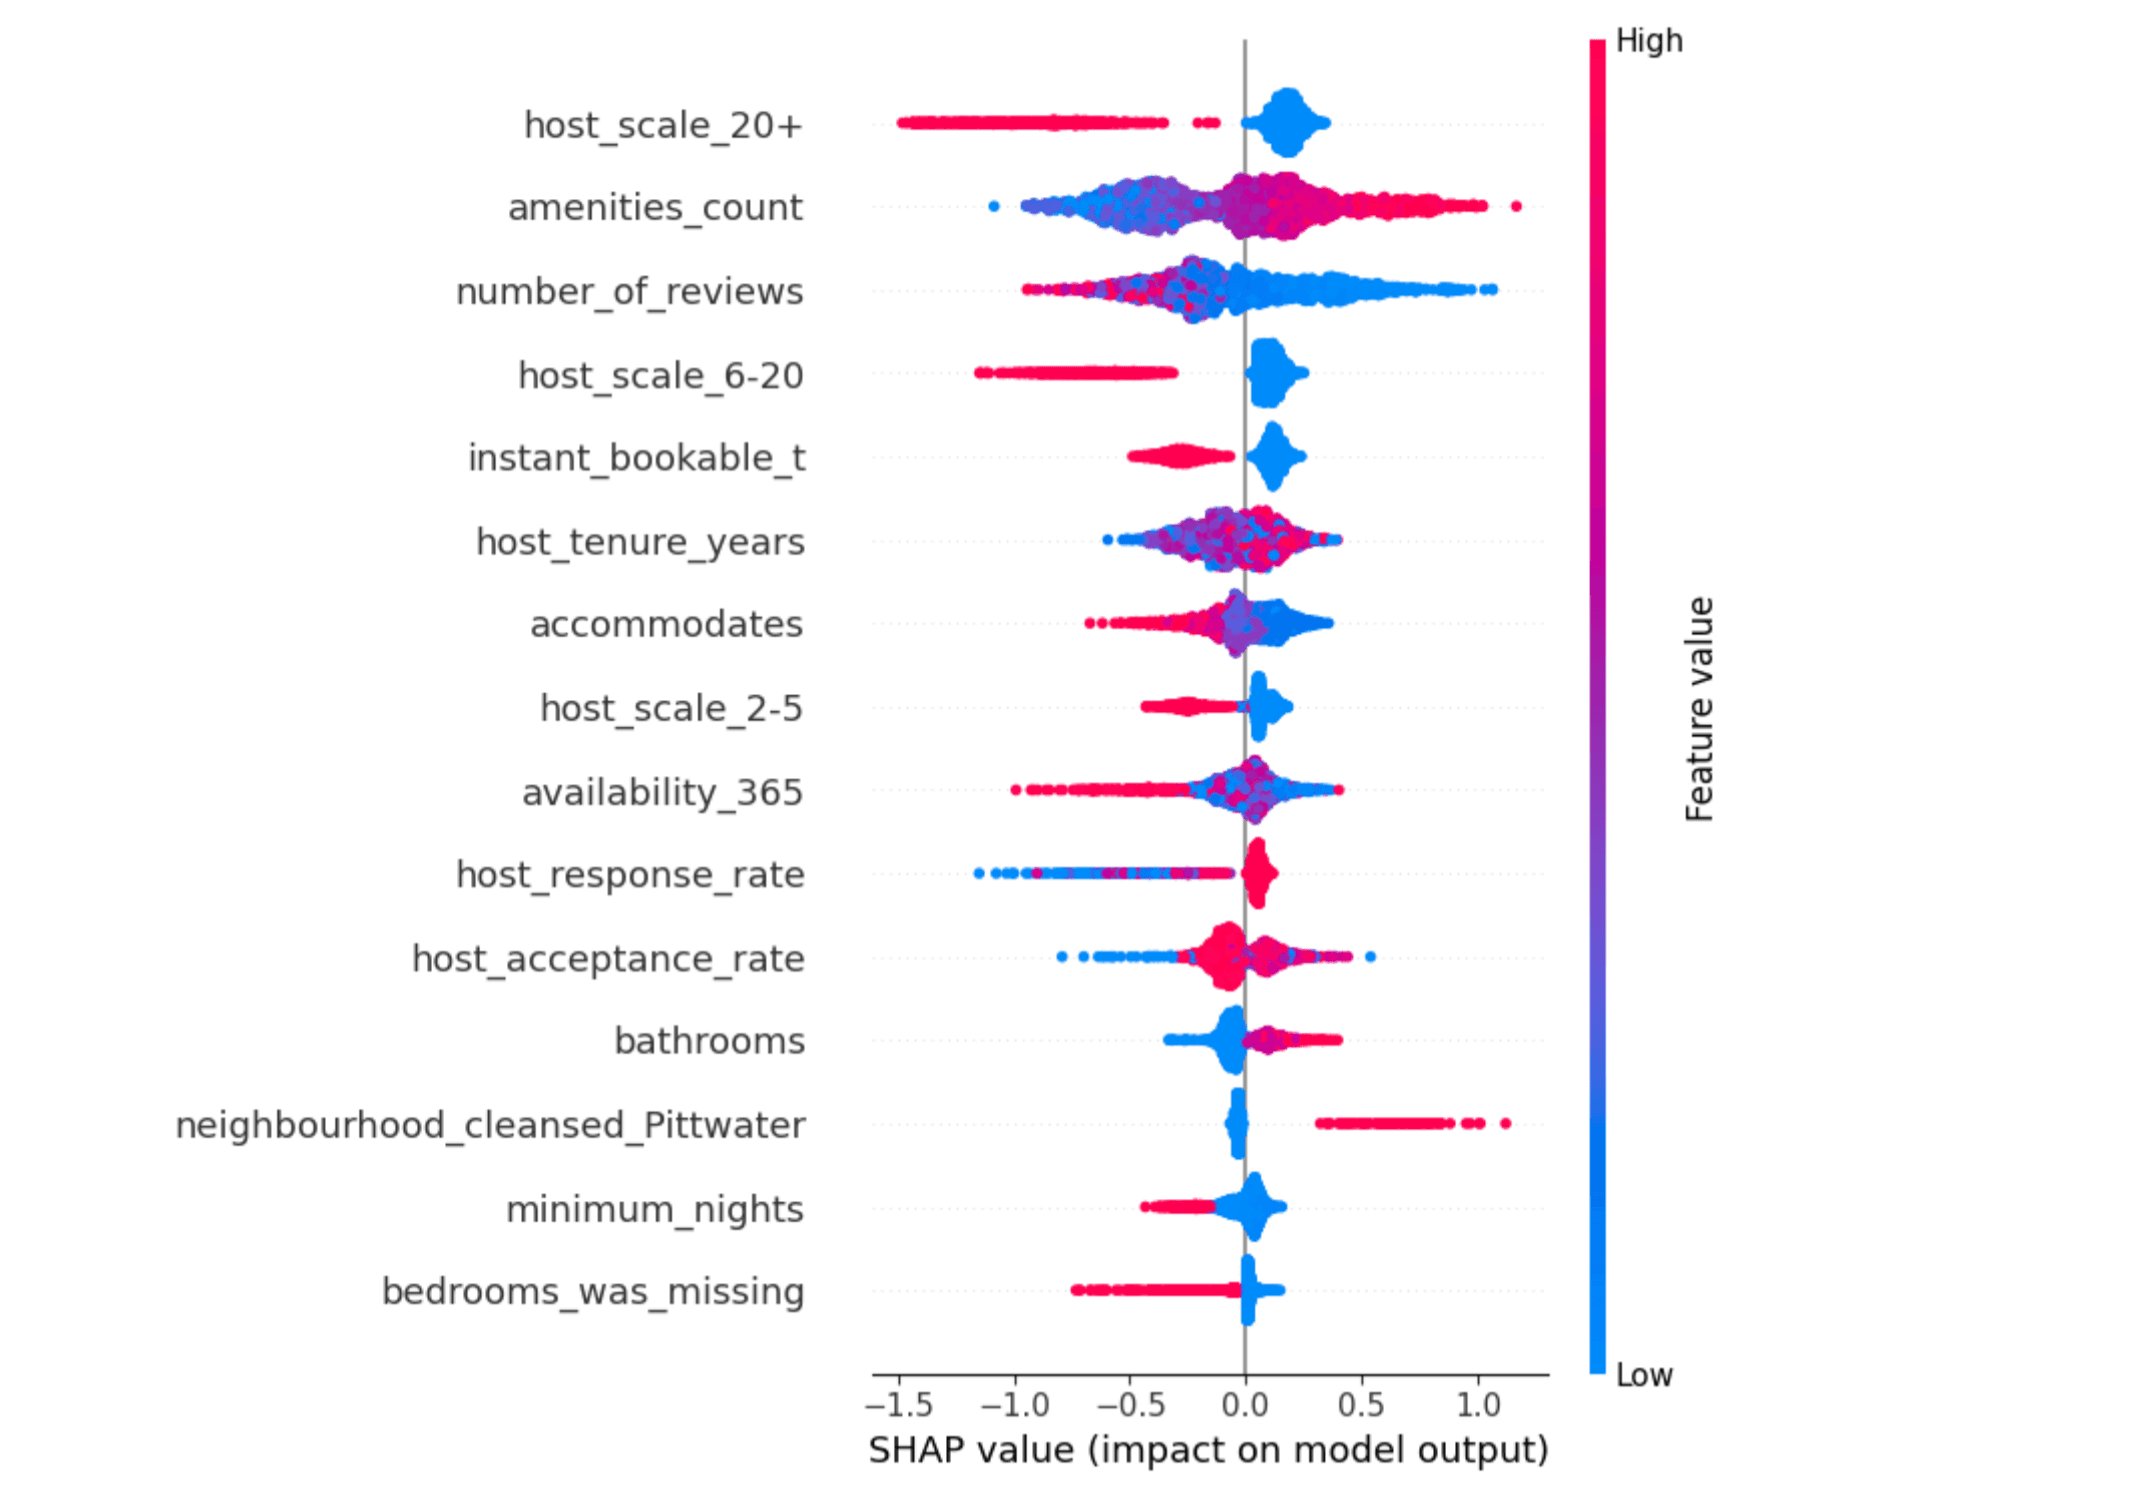
Then SHAP (TreeExplainer) delivered the headline. The strongest driver of guest satisfaction wasn't price or amenities. It was host portfolio size: single-listing hosts hit a 46.6% top-tier rate versus just 16.2% for hosts managing 20+ listings. That one insight also explained a misleading instant-bookable pattern in the raw data. Instant-booking looked like it hurt satisfaction, but it was really just a marker for large operators who can't personally vet every stay. Two different methods, EDA and SHAP, landing on the same answer.
What it produced.
02 figures
- Fig. 02
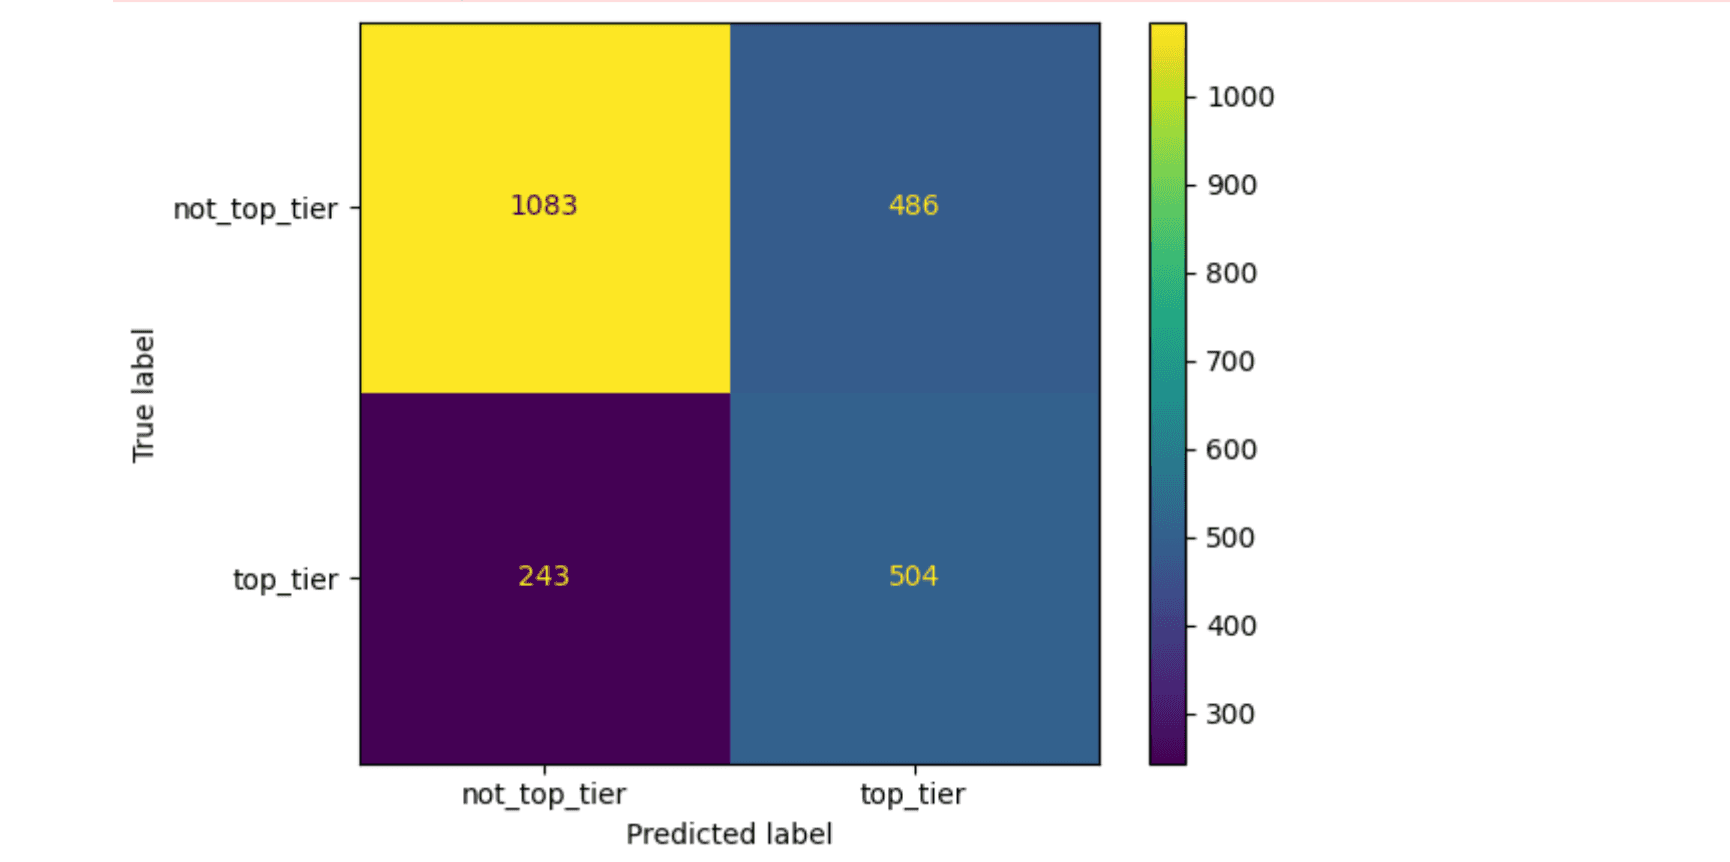
Confusion matrix on the held-out test set: top-tier vs. standard listings.
- Python
- scikit-learn
- XGBoost
- SHAP
Have a similar problem to solve?Let's talk it through.
I'm looking for a data analyst role in Sydney, and I have full working rights here. If something here looks like the work you need doing, get in touch.
Open to opportunitiesSydney, Australia