PayScopeDigital Payments Risk & Merchant Analytics Platform
End-to-end payments analytics and risk monitoring on PostgreSQL, from raw data to live Tableau dashboards.
- Role
- Solo project / independent build
- Stack
- PostgreSQL, SQL, Python, Tableau
- Scope
- 100K+ transactions · 10K customers · 1.2K merchants
- Source
- View on GitHub
100K+
Transactions processed
7
SQL business marts
69.7%
Trusted transaction coverage
3
Live Tableau dashboards
How it came together.
- 01
The system
I wanted to build a payments platform the way a real analytics team would run one: not a single notebook, but a system where raw data flows through clear stages and every number on a dashboard can be traced back to its source. So I engineered PayScope end to end on PostgreSQL, moving data through a layered raw → clean → mart architecture across 3 schemas, and put 100K+ transactions across 10K customers and 1.2K merchants through it.
- 02
Data quality
The core of it is a Python ETL and data-quality framework (pandas, SQLAlchemy, psycopg2) that deliberately injects realistic problems like nulls, duplicates, broken foreign keys, invalid codes, then detects and flags them. The decision I care about most here: invalid records are flagged instead of deleted, so the audit trail stays intact and analysts can see exactly what was wrong. That discipline lifted trusted transaction coverage to 69.7%.
- 03
The mart layer
On top of the clean layer I developed 7 SQL business marts using an aggregate-before-join pattern to stop grain-mismatch double-counting, the kind of silent bug that quietly inflates every metric downstream. Those marts power merchant-performance, chargeback, and customer-risk reporting.
- 04
The finding
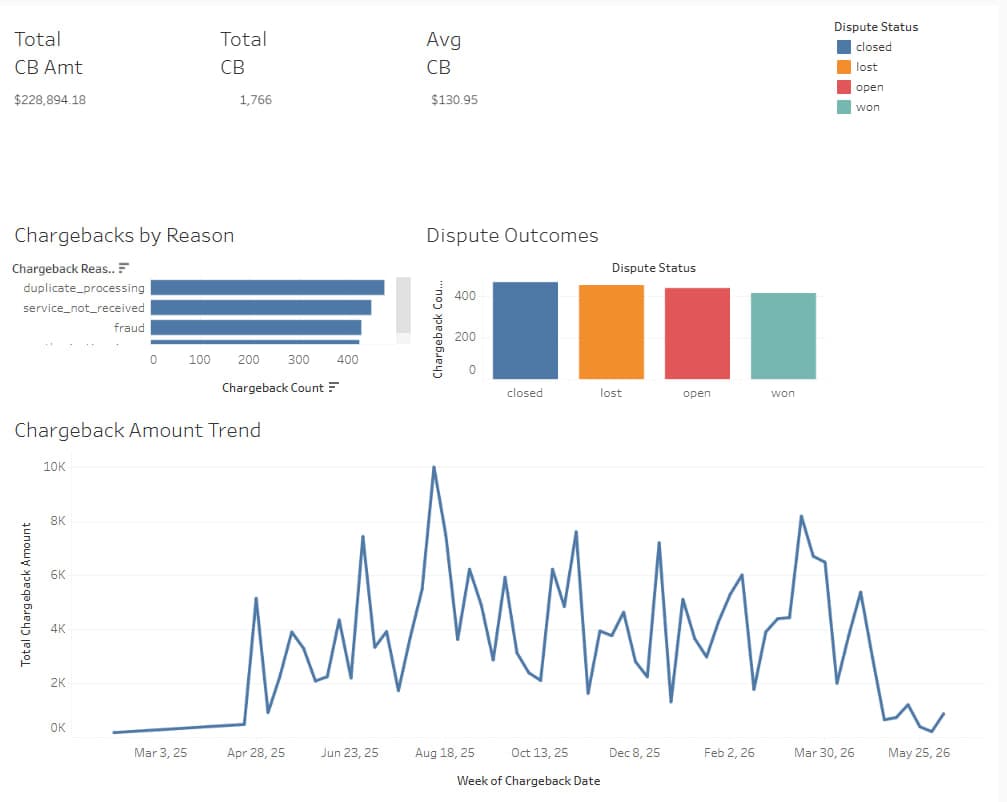
The finding I'm proudest of came from the explainable rule-based risk engine I designed. Its behaviour-driven merchant segmentation (Critical / High Risk / Monitor / Low Risk) surfaced that the source-system risk tiers diverged from how merchants actually behaved: the labels the data arrived with weren't telling the truth. I wired the whole thing into 3 interactive Tableau dashboards (Transaction Monitoring, Merchant Risk, and Chargeback Analysis), all connected live to the mart layer.
What it produced.
03 figures
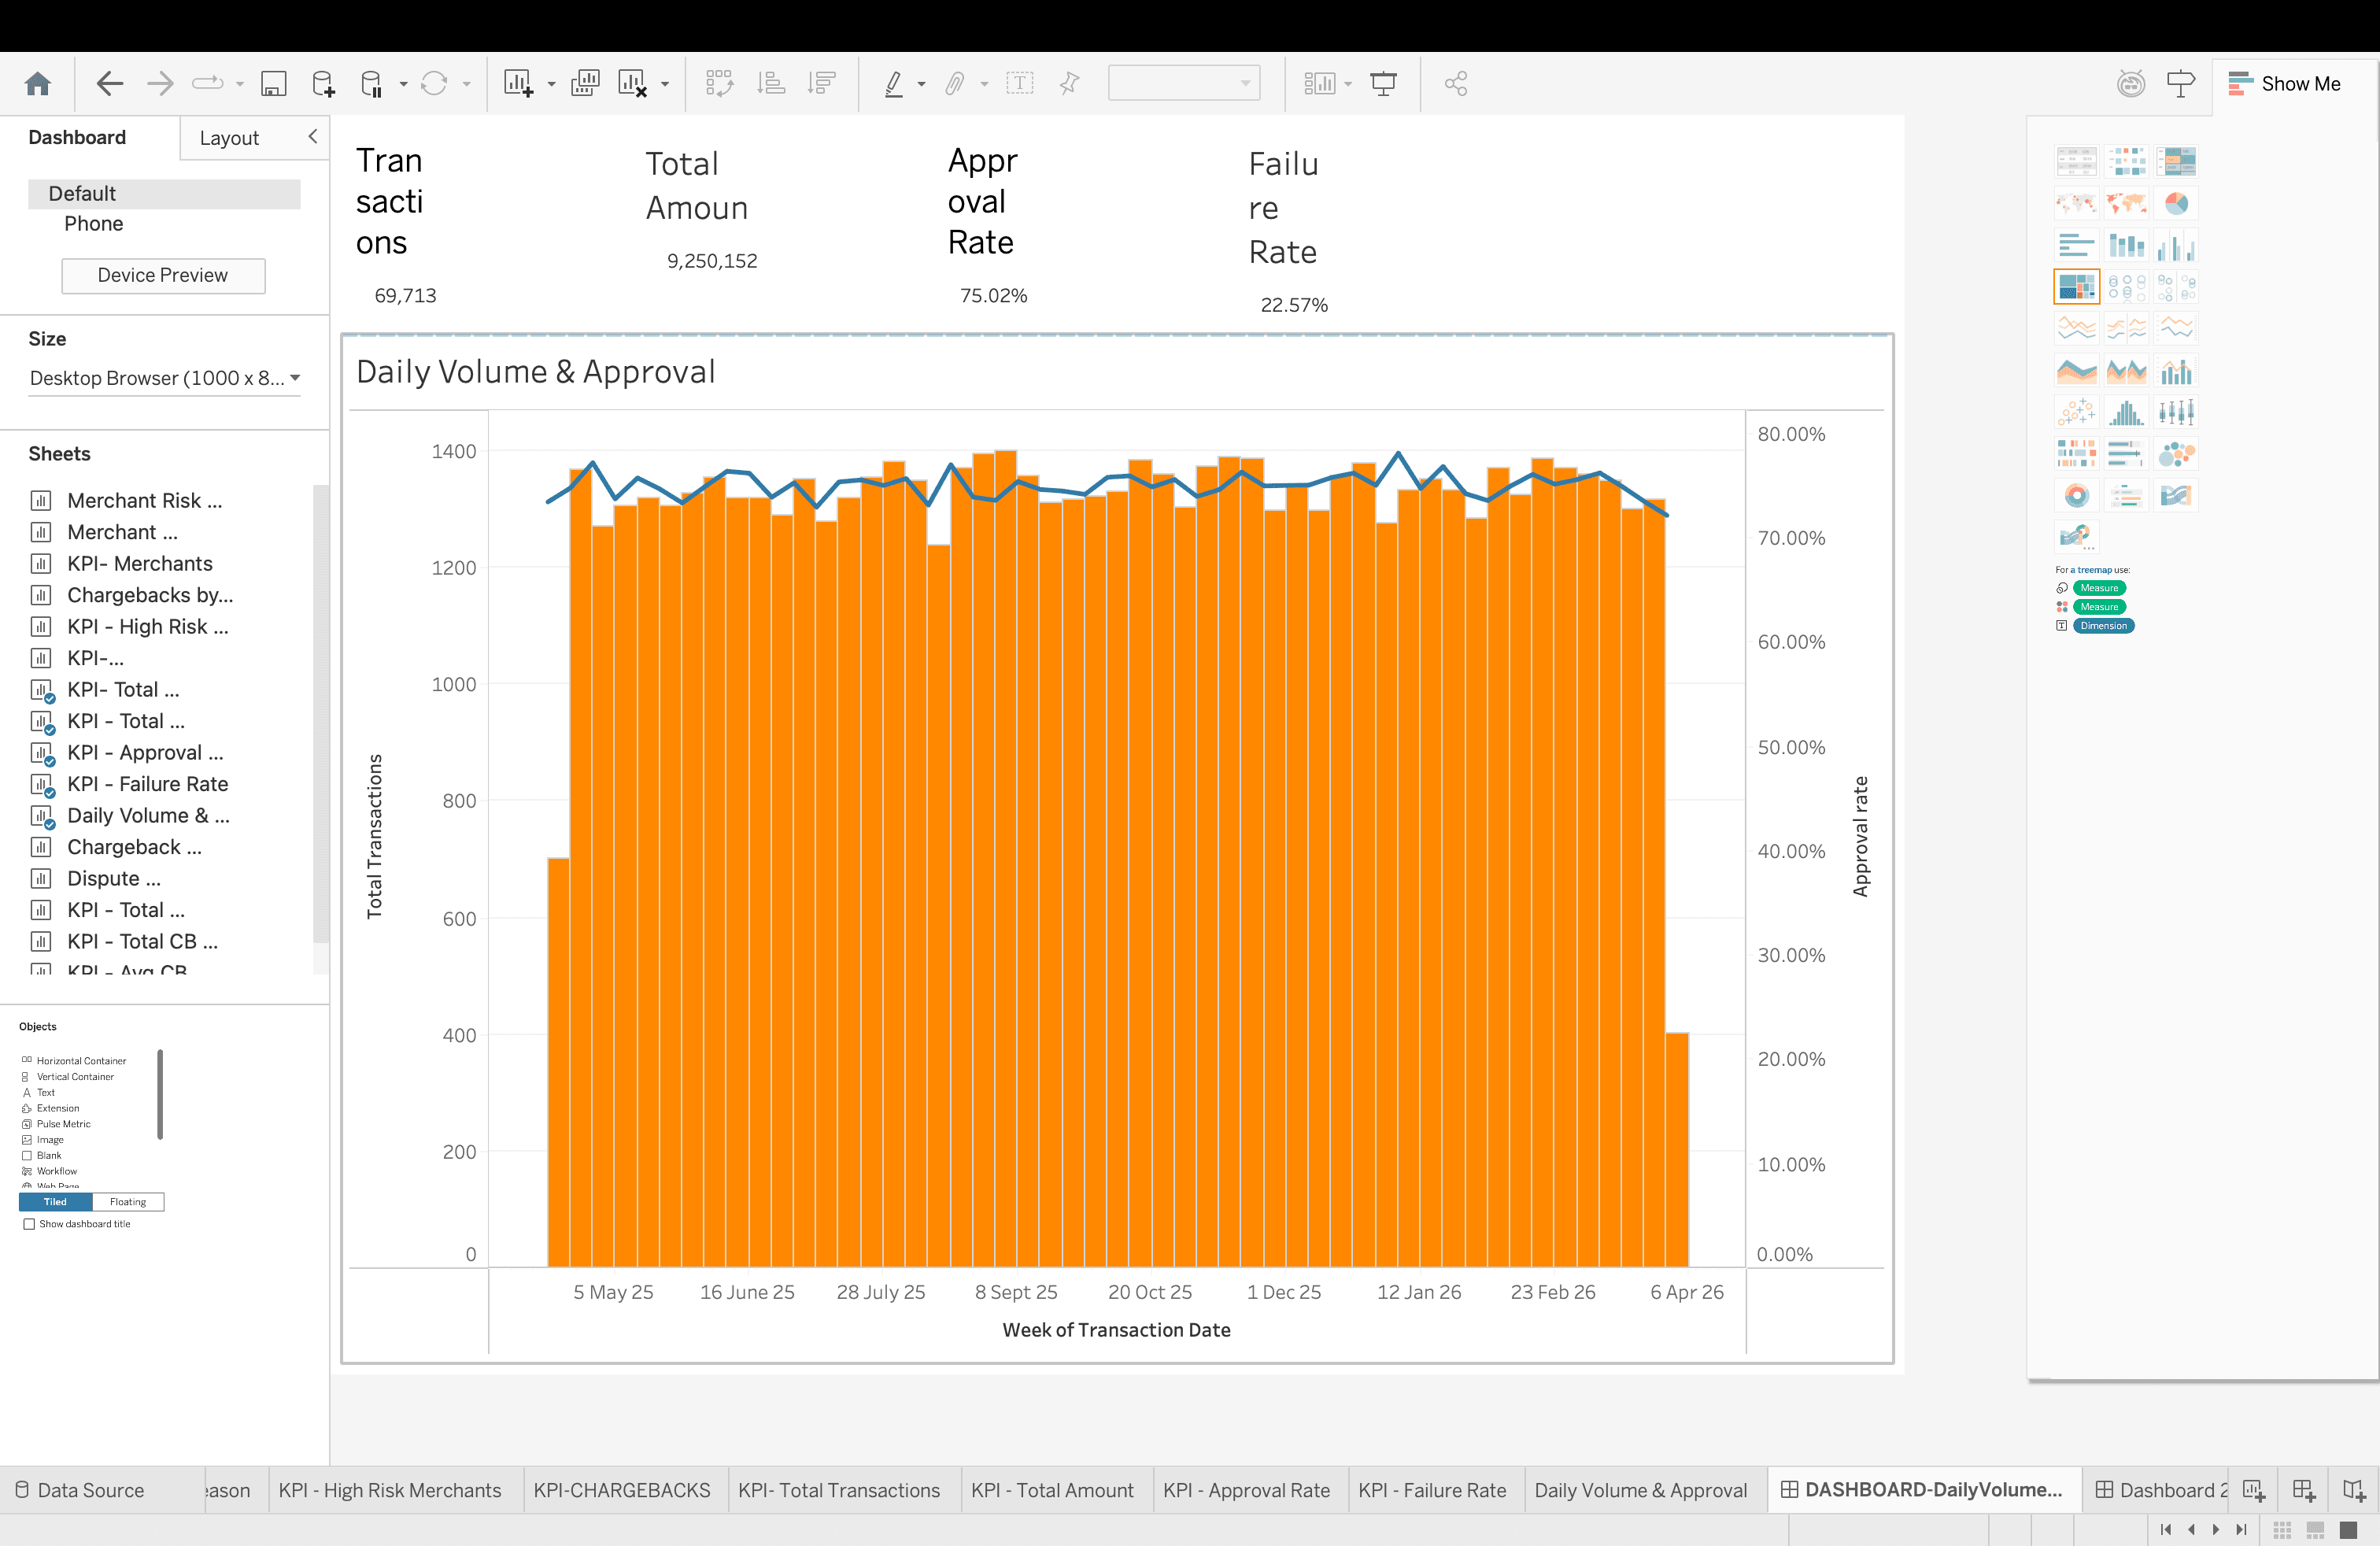
- Fig. 02
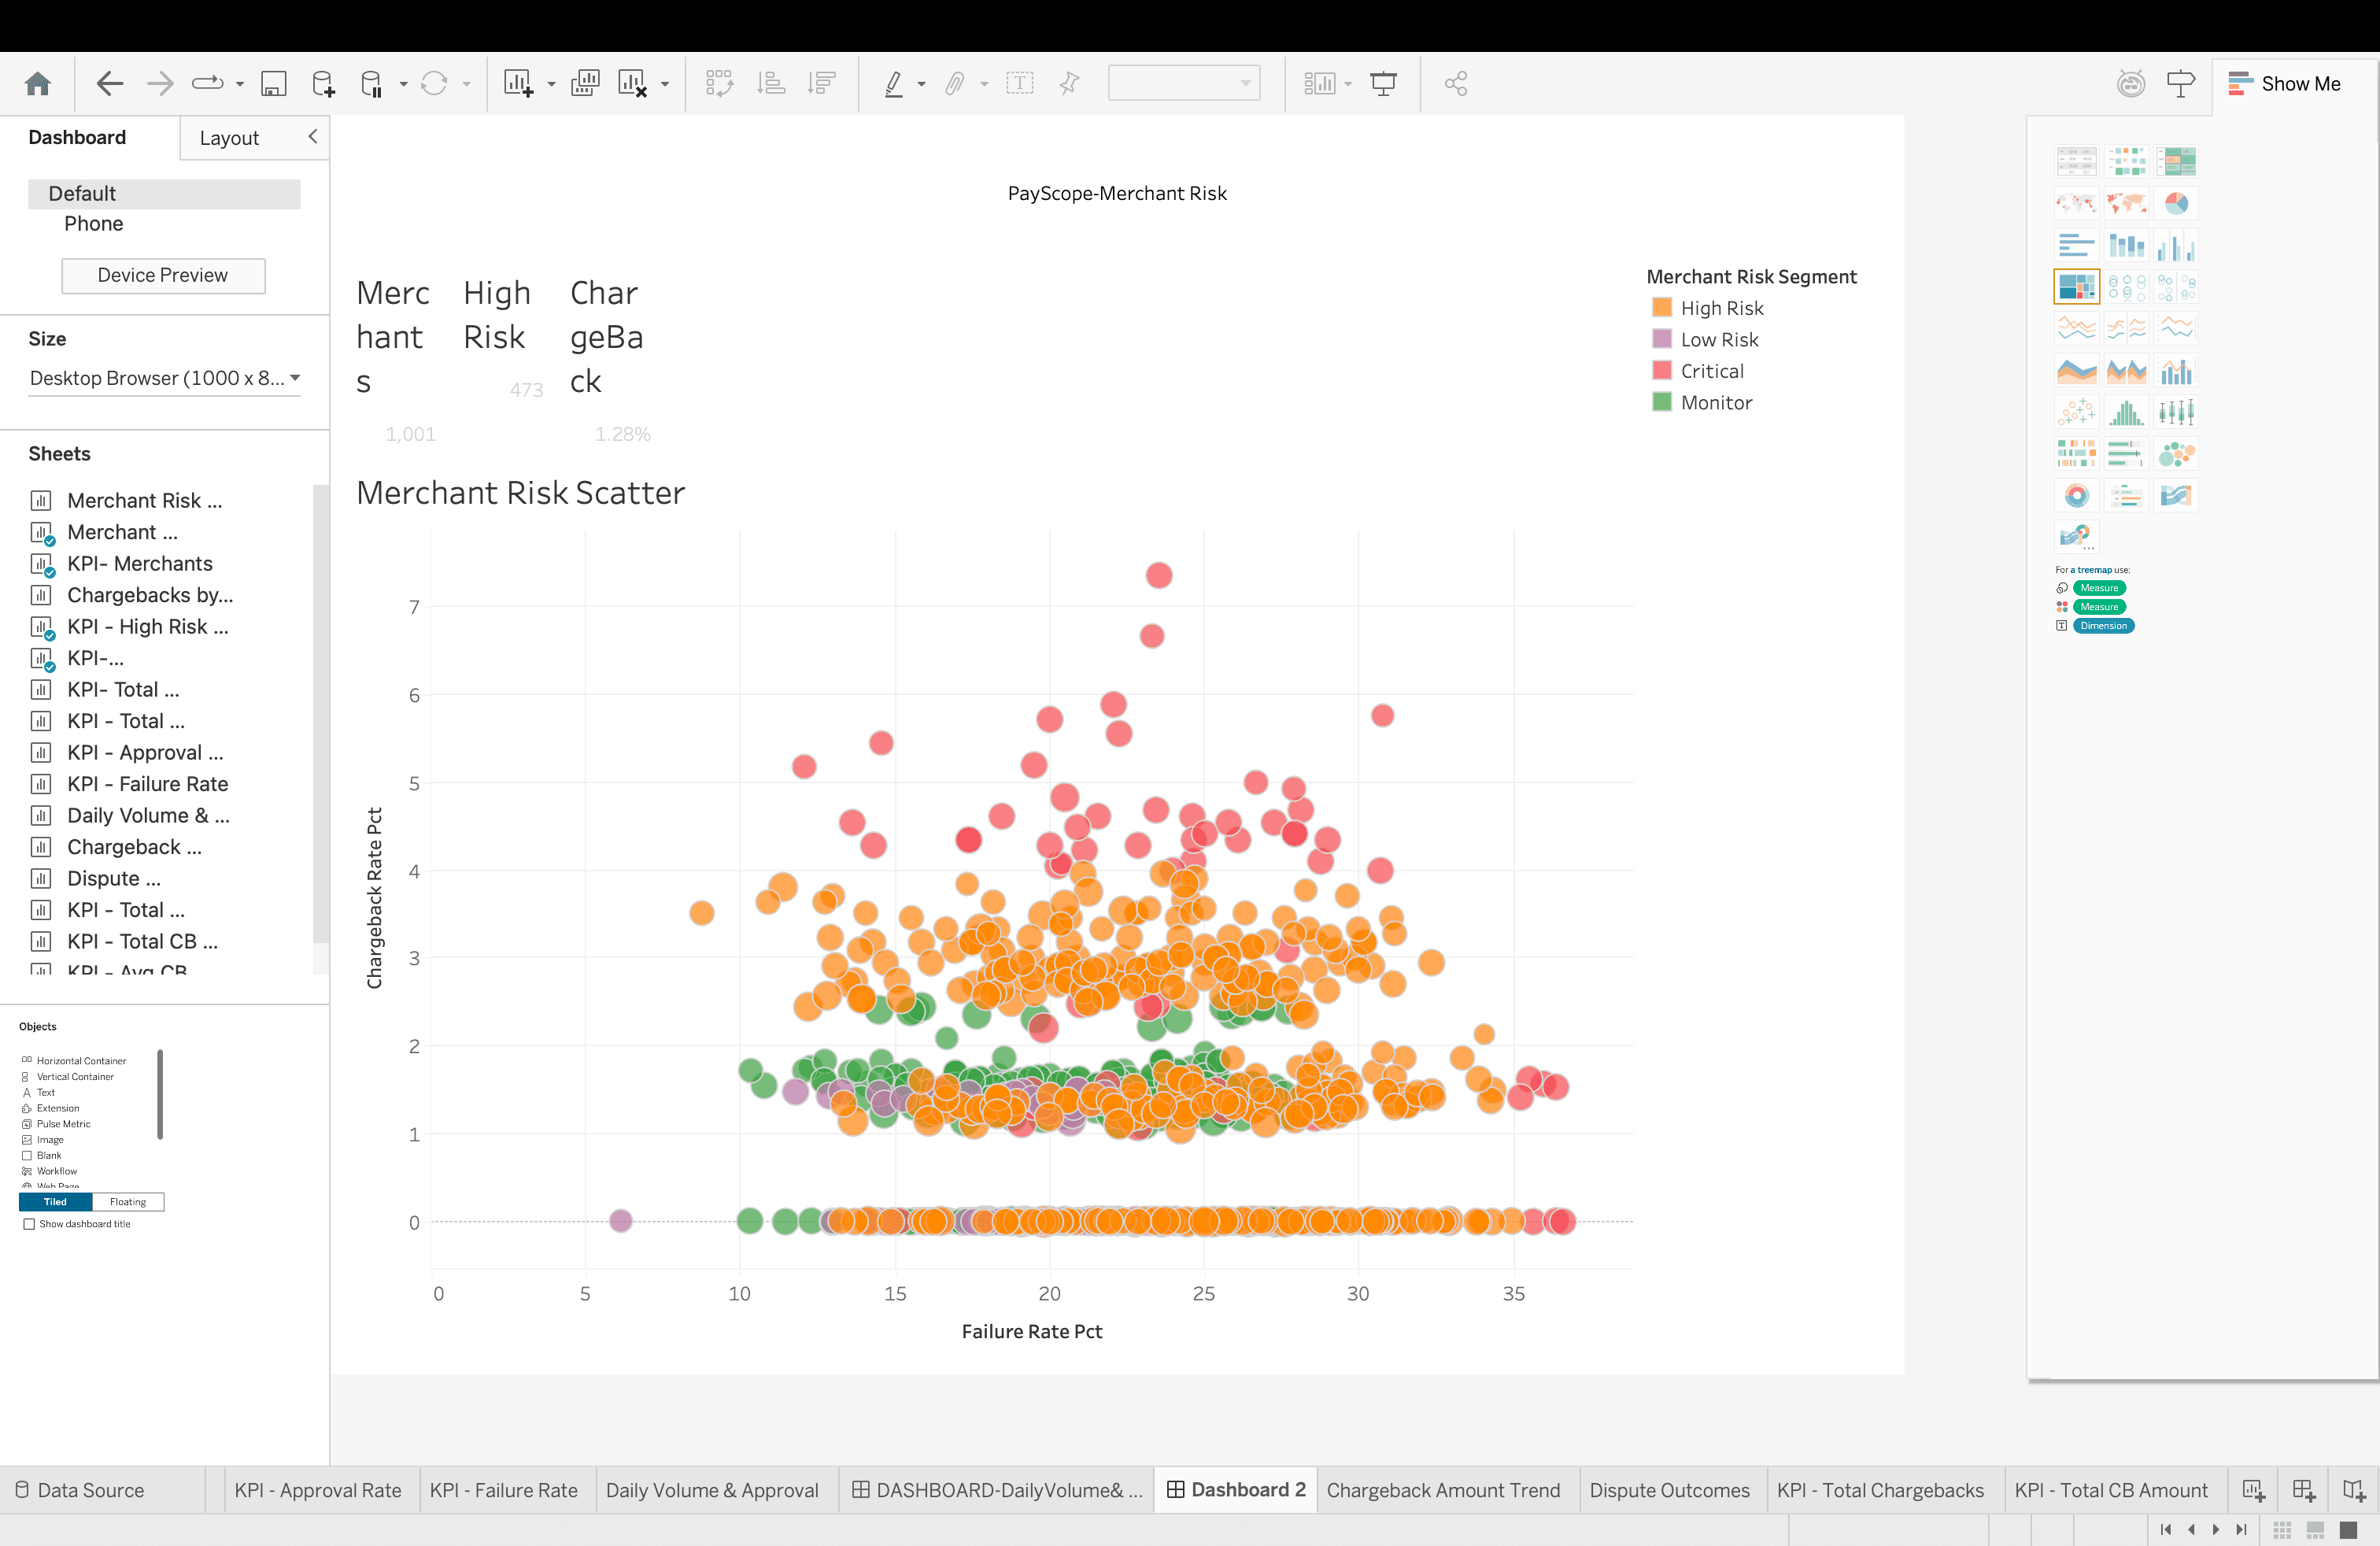
Merchant Risk: chargeback rate vs. failure rate, coloured by behaviour-driven segment. - Fig. 03
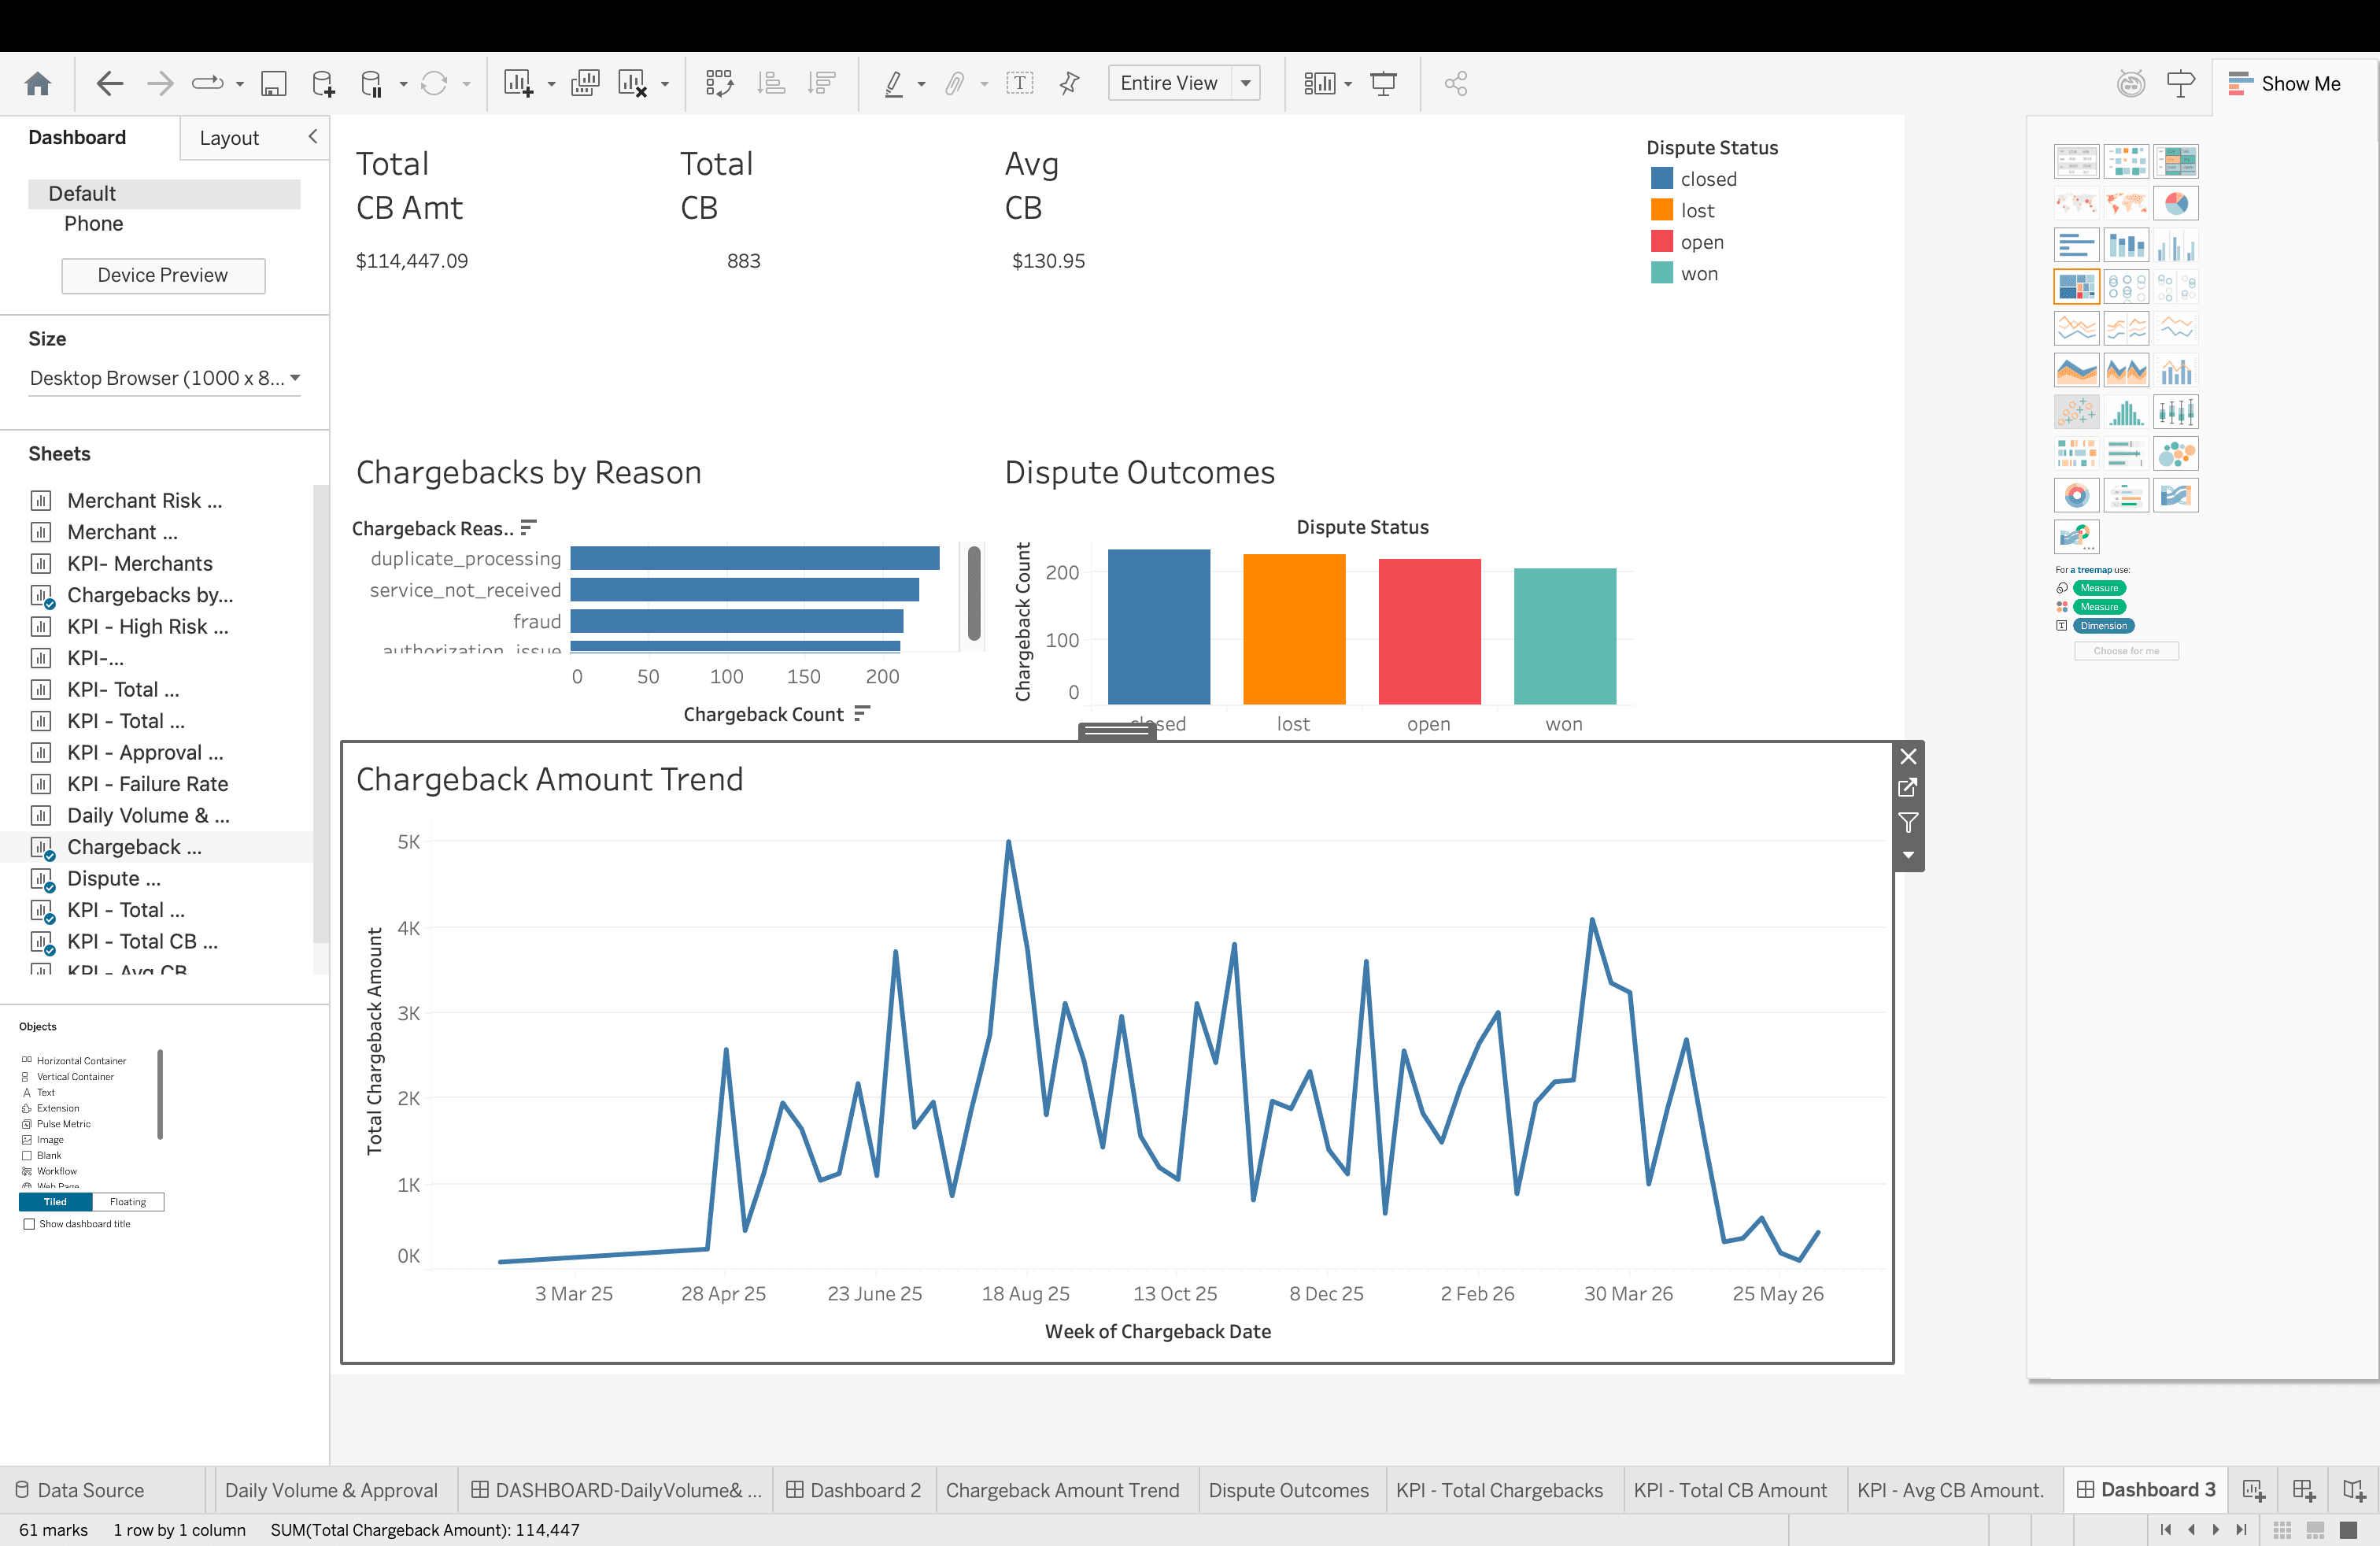
Chargeback Analysis: chargebacks by reason, dispute outcomes, and weekly amount trend.
- PostgreSQL
- SQL
- Python
- Tableau
Have a similar problem to solve?Let's talk it through.
I'm looking for a data analyst role in Sydney, and I have full working rights here. If something here looks like the work you need doing, get in touch.
Open to opportunitiesSydney, Australia