Organ Disease Progression VisualizerImaging-Driven 3D Lung Model
A deterministic pipeline that turns chest CT images into a live, signal-driven 3D lung visualisation.
- Role
- Technical Lead, full system implementation (COMP8851 team project)
- Stack
- Python, OpenCV, PyVista, Trimesh, NumPy
- Scope
- 8 clinical CT cases · scored 0.218–0.809
- Source
- View on GitHub
8
Clinical CT cases scored
3
Signals extracted per scan
0.218–0.809
Progression score range
100%
Runs with a JSON audit trail
How it came together.
- 01
The system
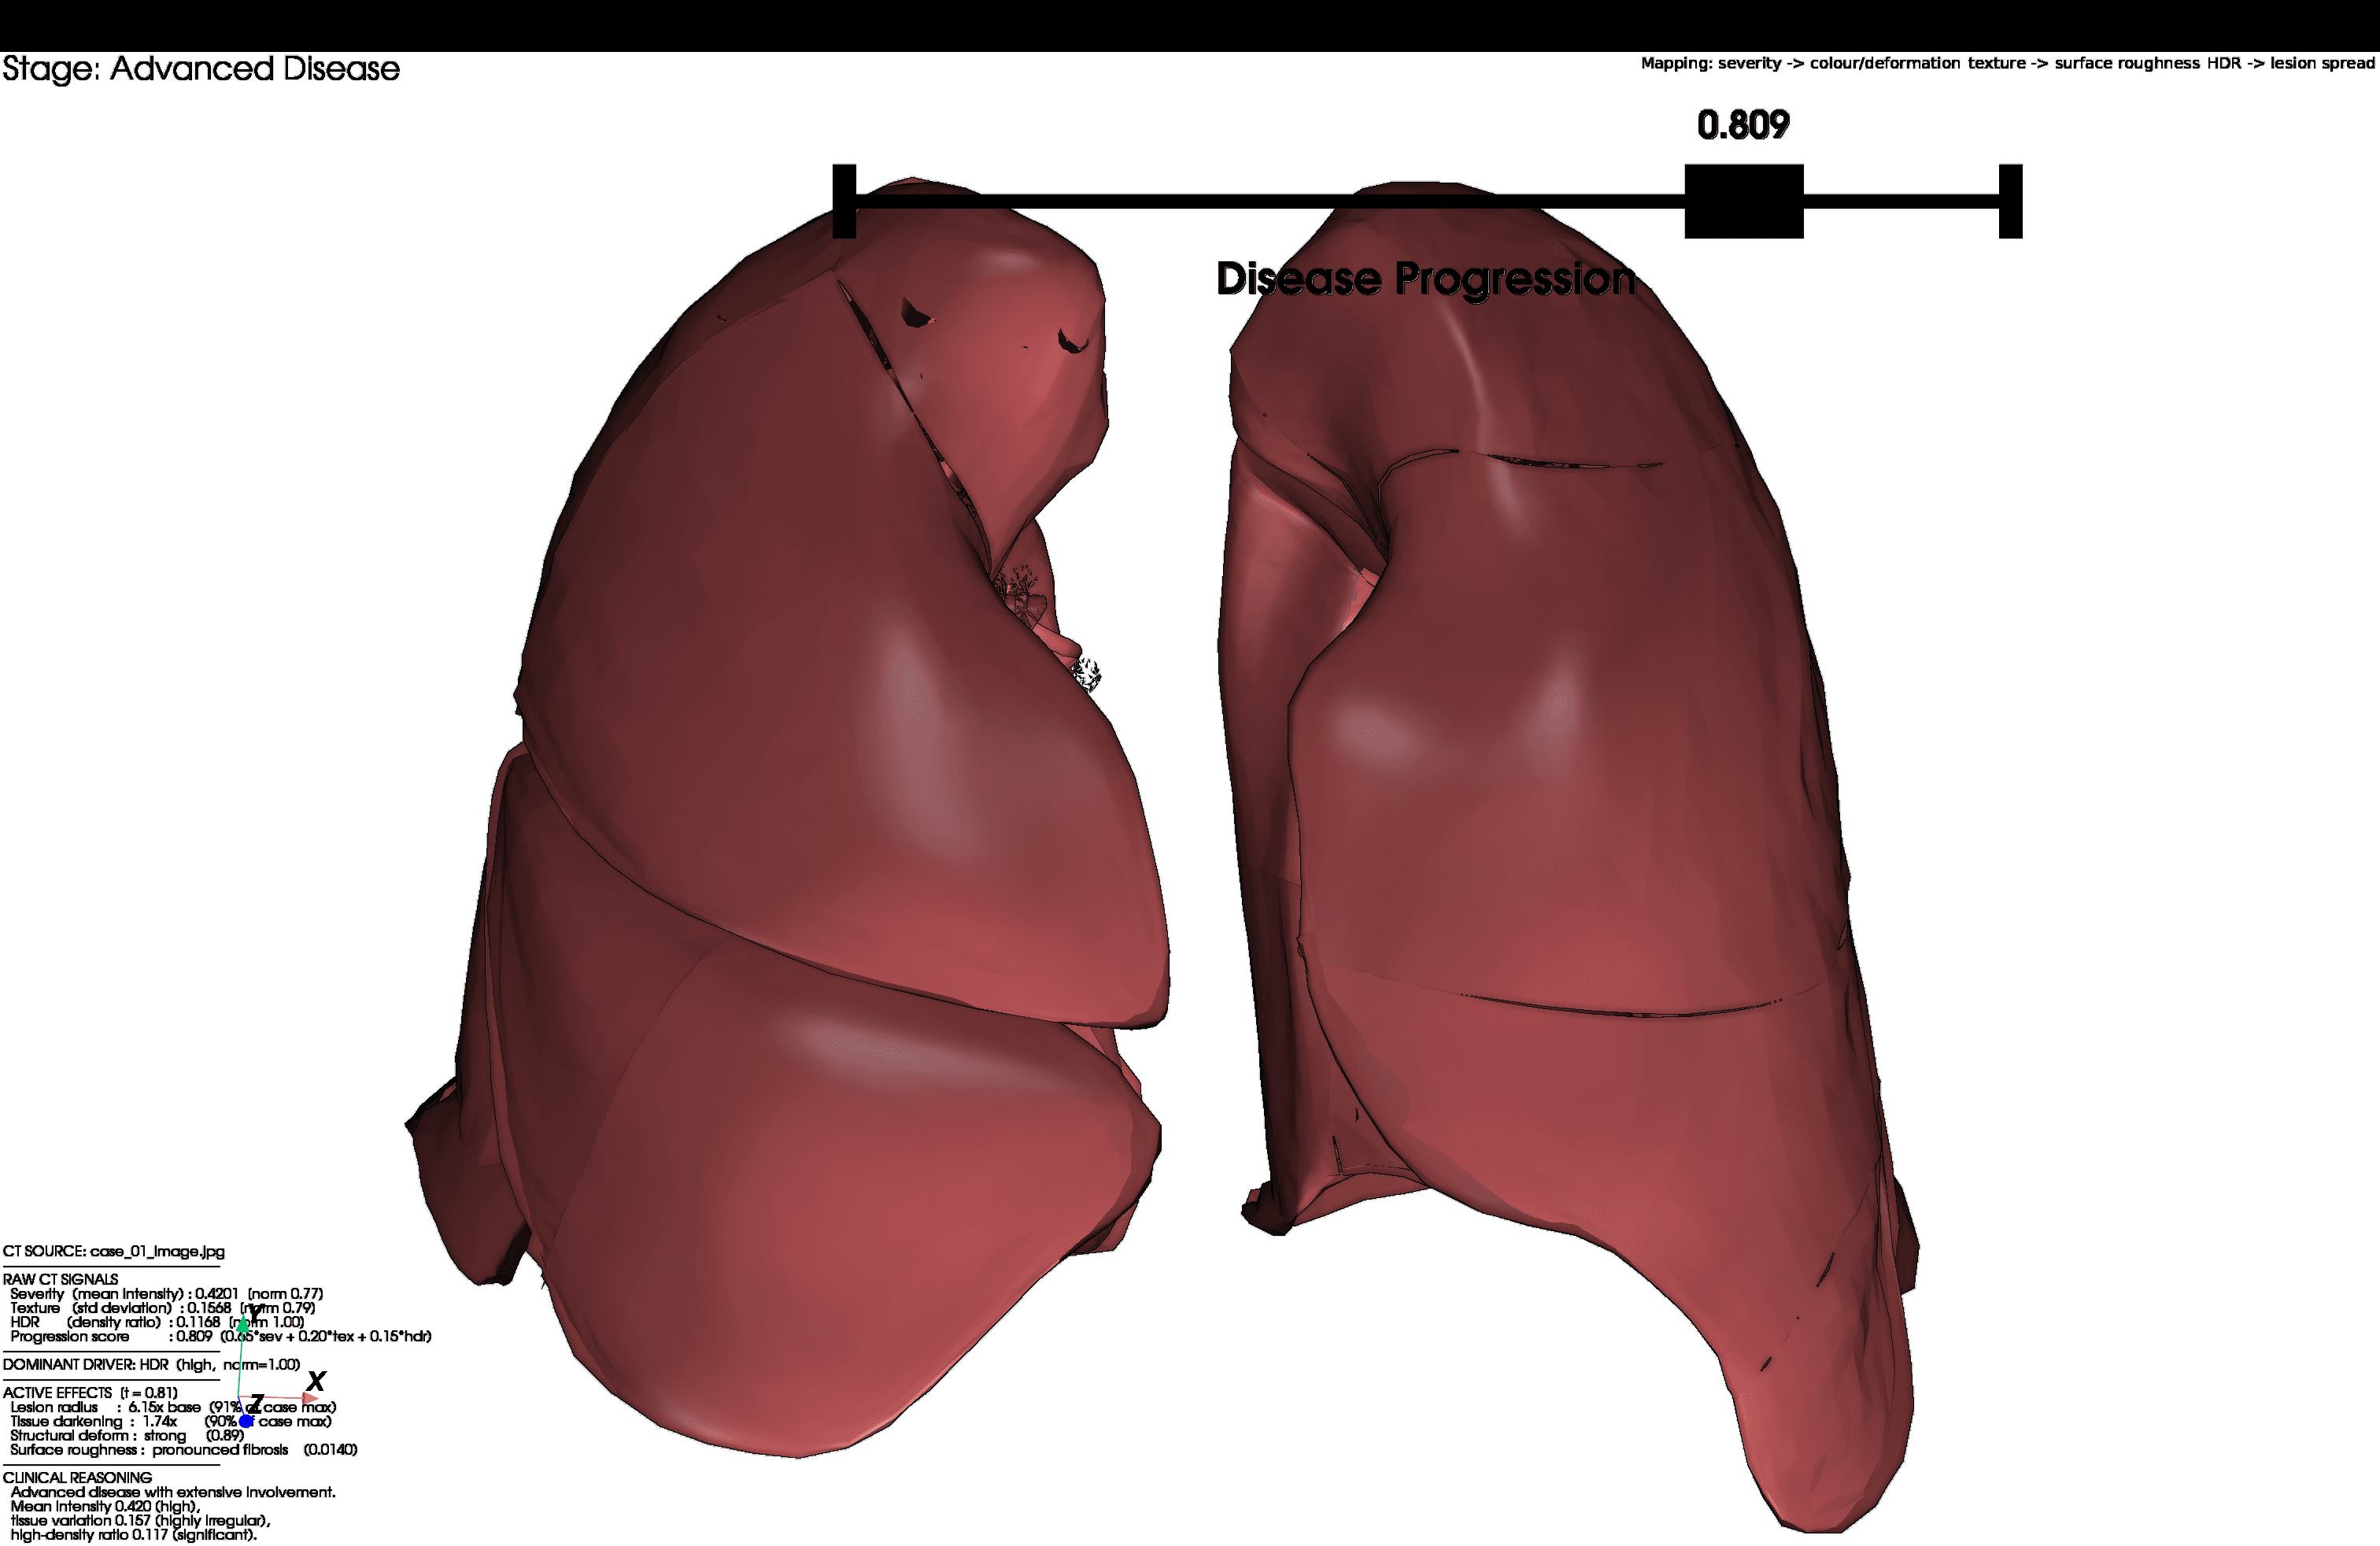
Can you tell what stage a lung disease is at just from a CT scan? Most people can't, so as technical lead on this Macquarie COMP8851 project I built a system that can, and that shows you exactly why. It's a deterministic Python pipeline that processes real chest CT images and maps quantitative signals directly onto an anatomical 3D lung mesh, with interactive case switching in the viewer.
- 02
The signals
From each scan the pipeline extracts three numbers: severity (mean pixel intensity), texture (standard deviation), and HDR, the proportion of pixels above a density threshold, standing in for dense lesion and fibrosis coverage. Those combine into one progression score: 0.65 × Severity + 0.20 × Texture + 0.15 × HDR. Every number on screen came from a pixel in the CT image.
- 03
Driving the model
That score then drives the 3D model: colour, lesion spread, surface roughness, and structural deformation all respond to it. I ran 8 clinical cases through the system, spanning 0.218 (near-healthy) through to 0.809 (advanced fibrosis), so the reference lung visibly deforms from smooth and light to darkened, volume-lost, and fibrotic as the disease advances.
- 04
Traceability
Because this is a medical context, traceability was non-negotiable. Every run writes a JSON audit trail logging each pipeline decision: the extracted values, the weighting calculation, the disease-staging transition, and the exact count of affected mesh vertices. Eight cases, eight audit logs, every decision traceable back to the input.
What it produced.
05 figures
- Fig. 02
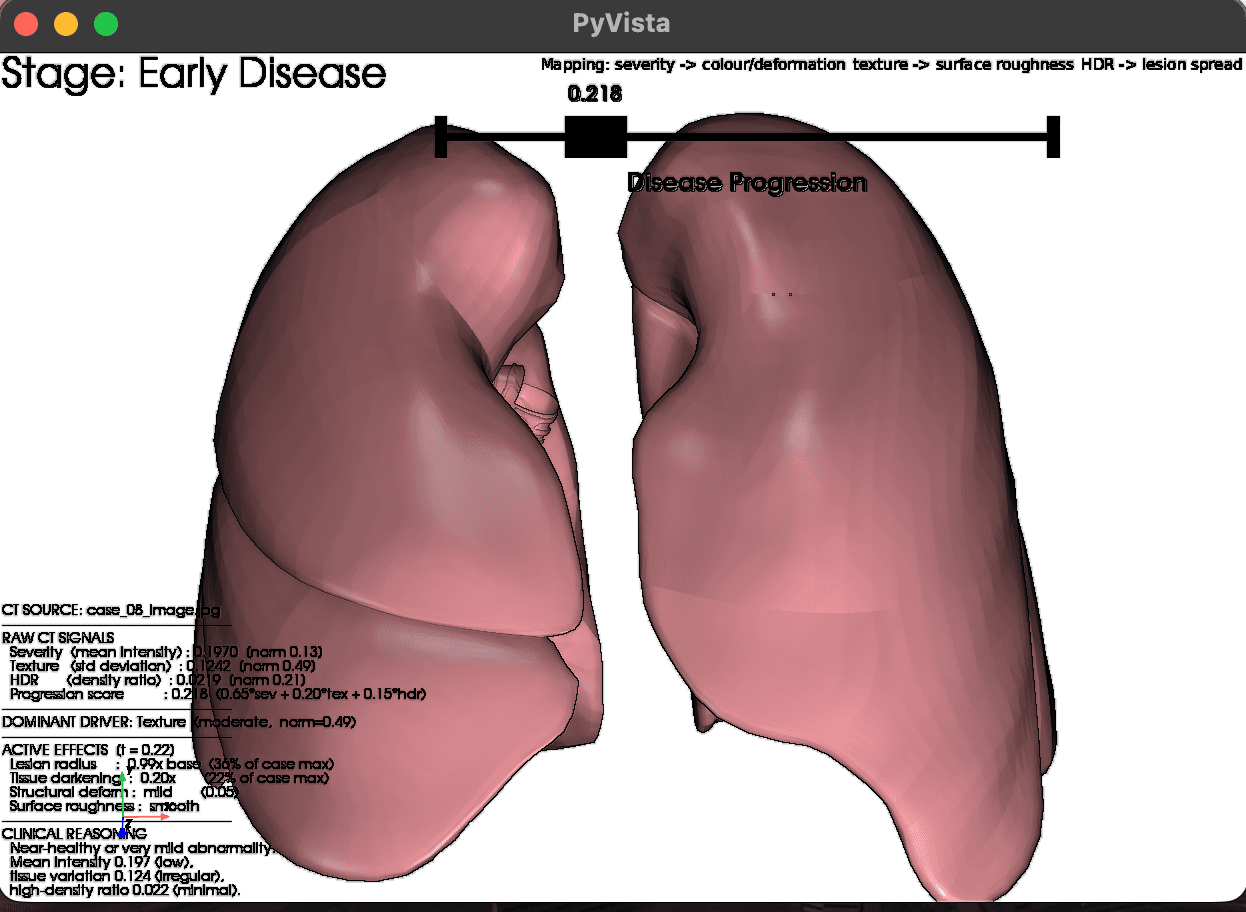
Case 08: near-healthy (0.218). Light colour, smooth surface, minimal deformation. - Fig. 03
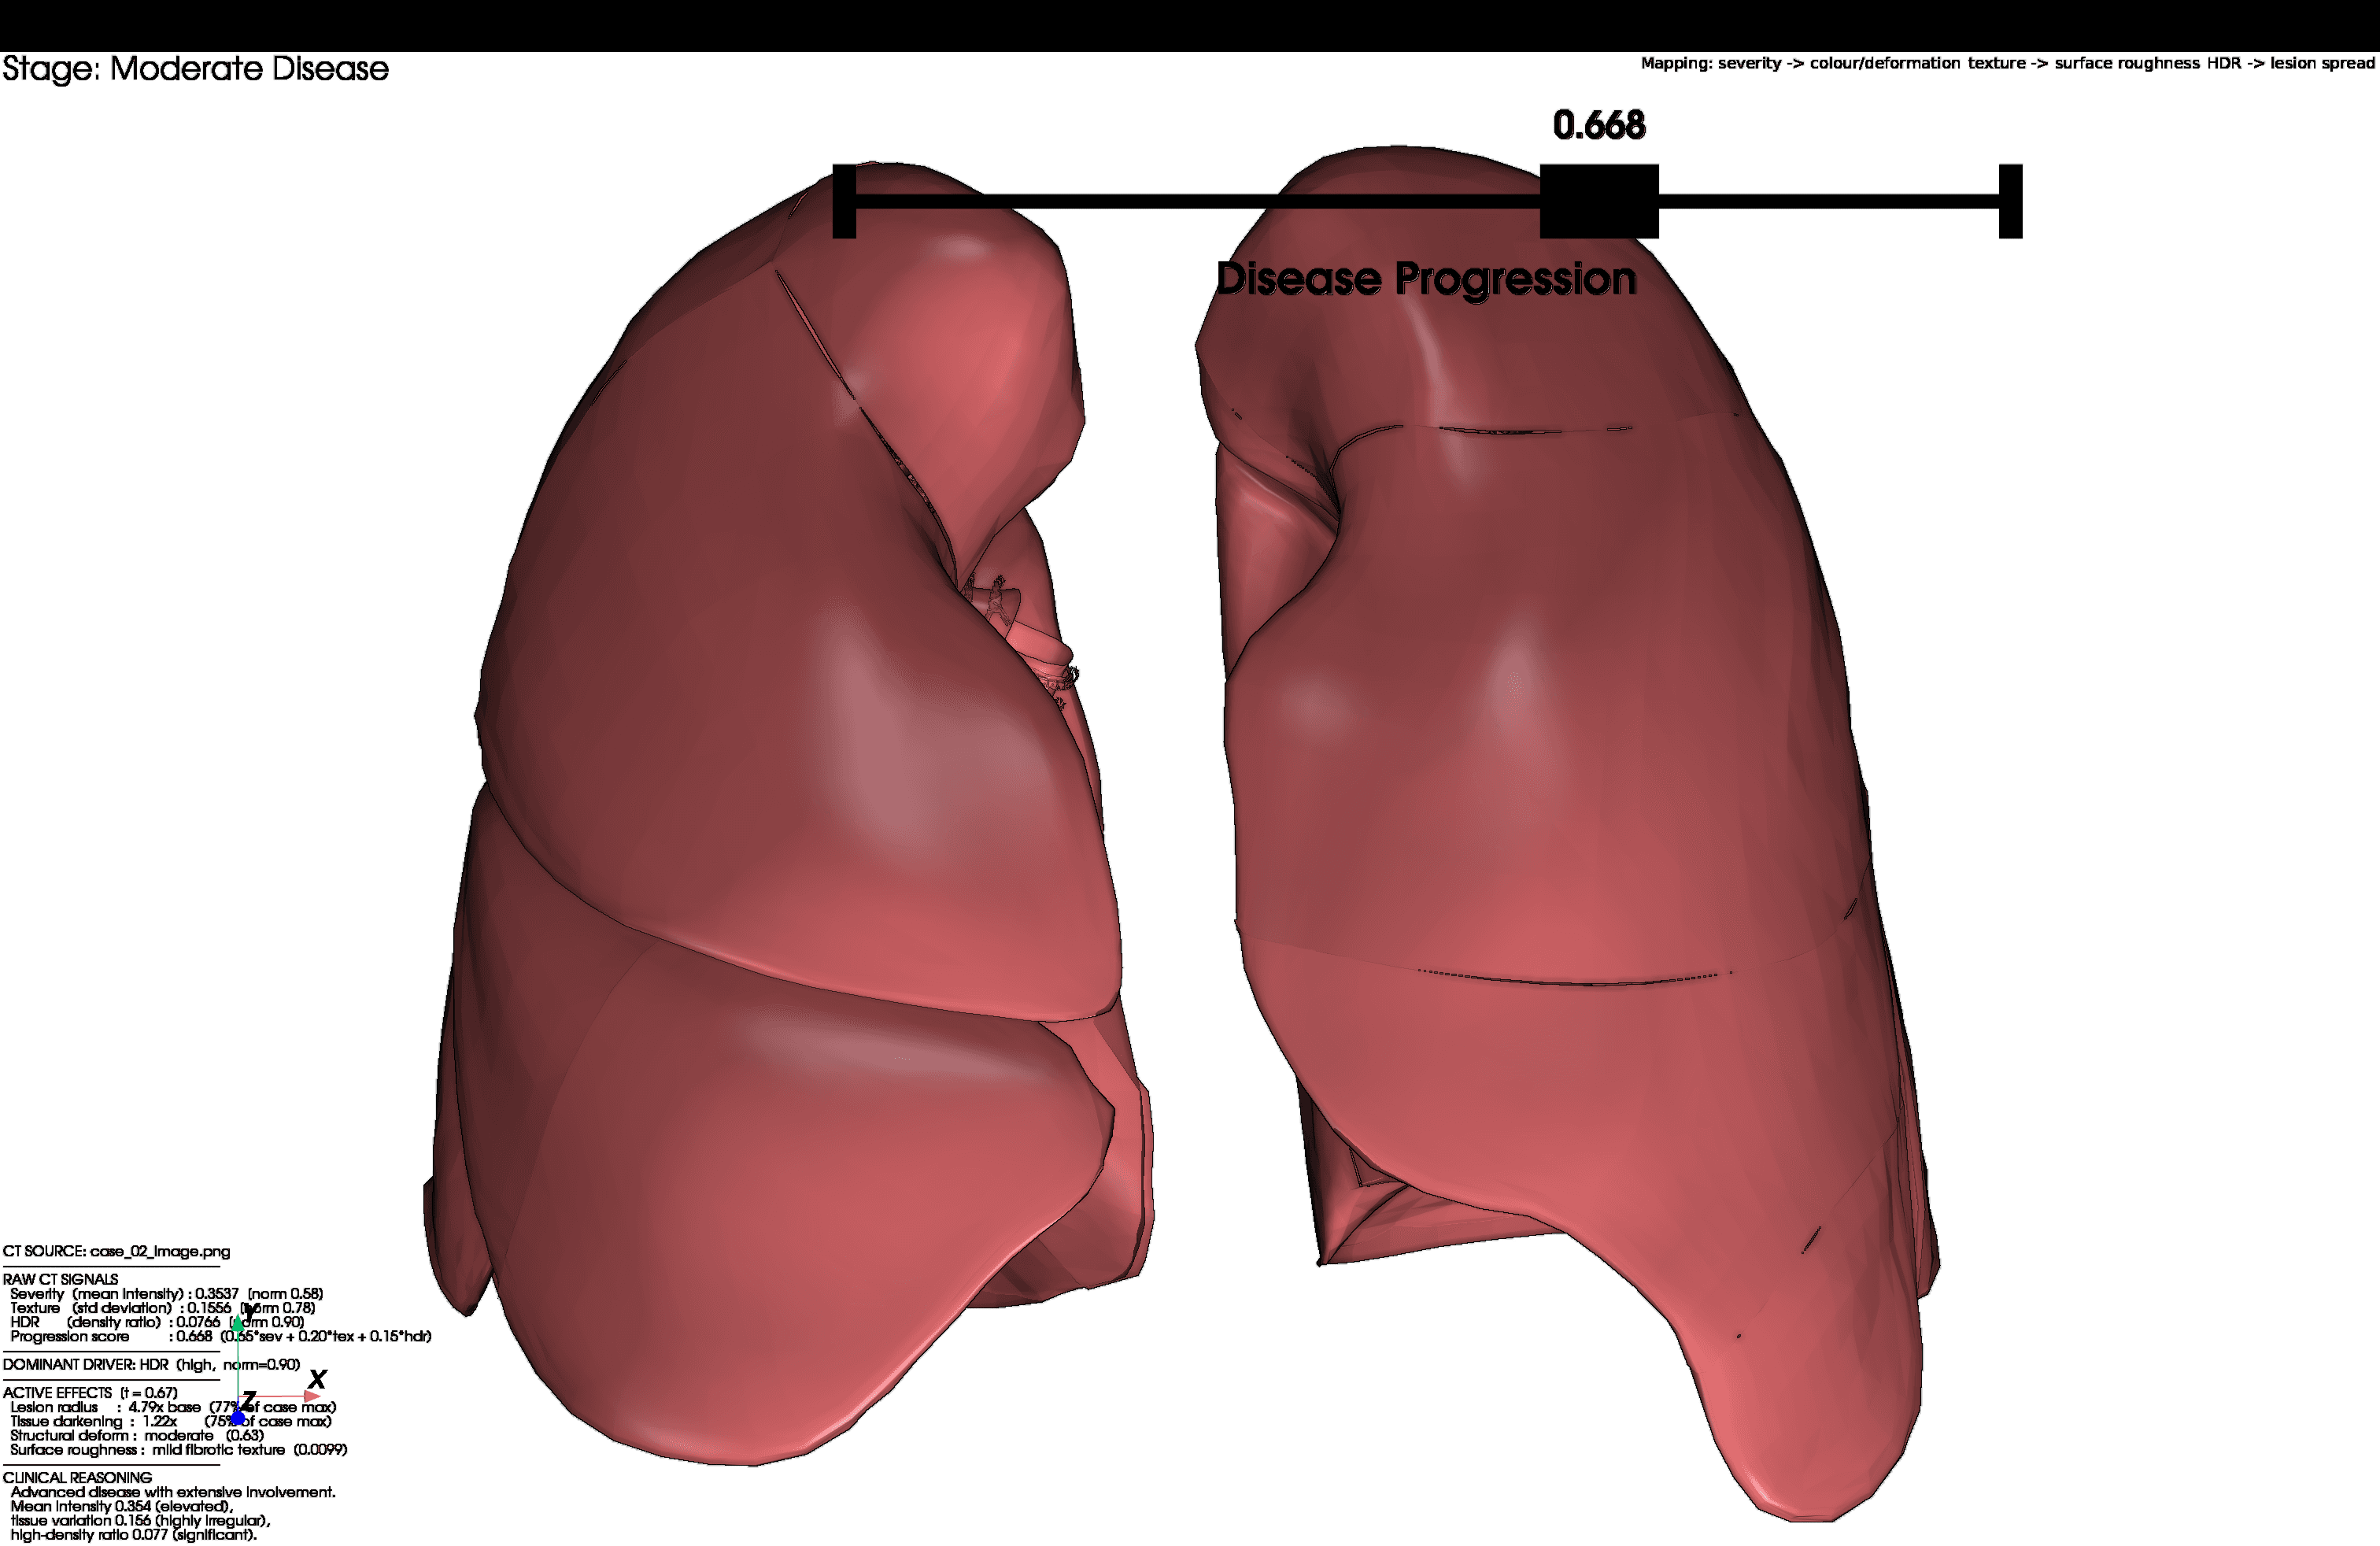
Case 02: moderate (0.668). HDR-dominant, mild fibrotic texture emerging. - Fig. 04
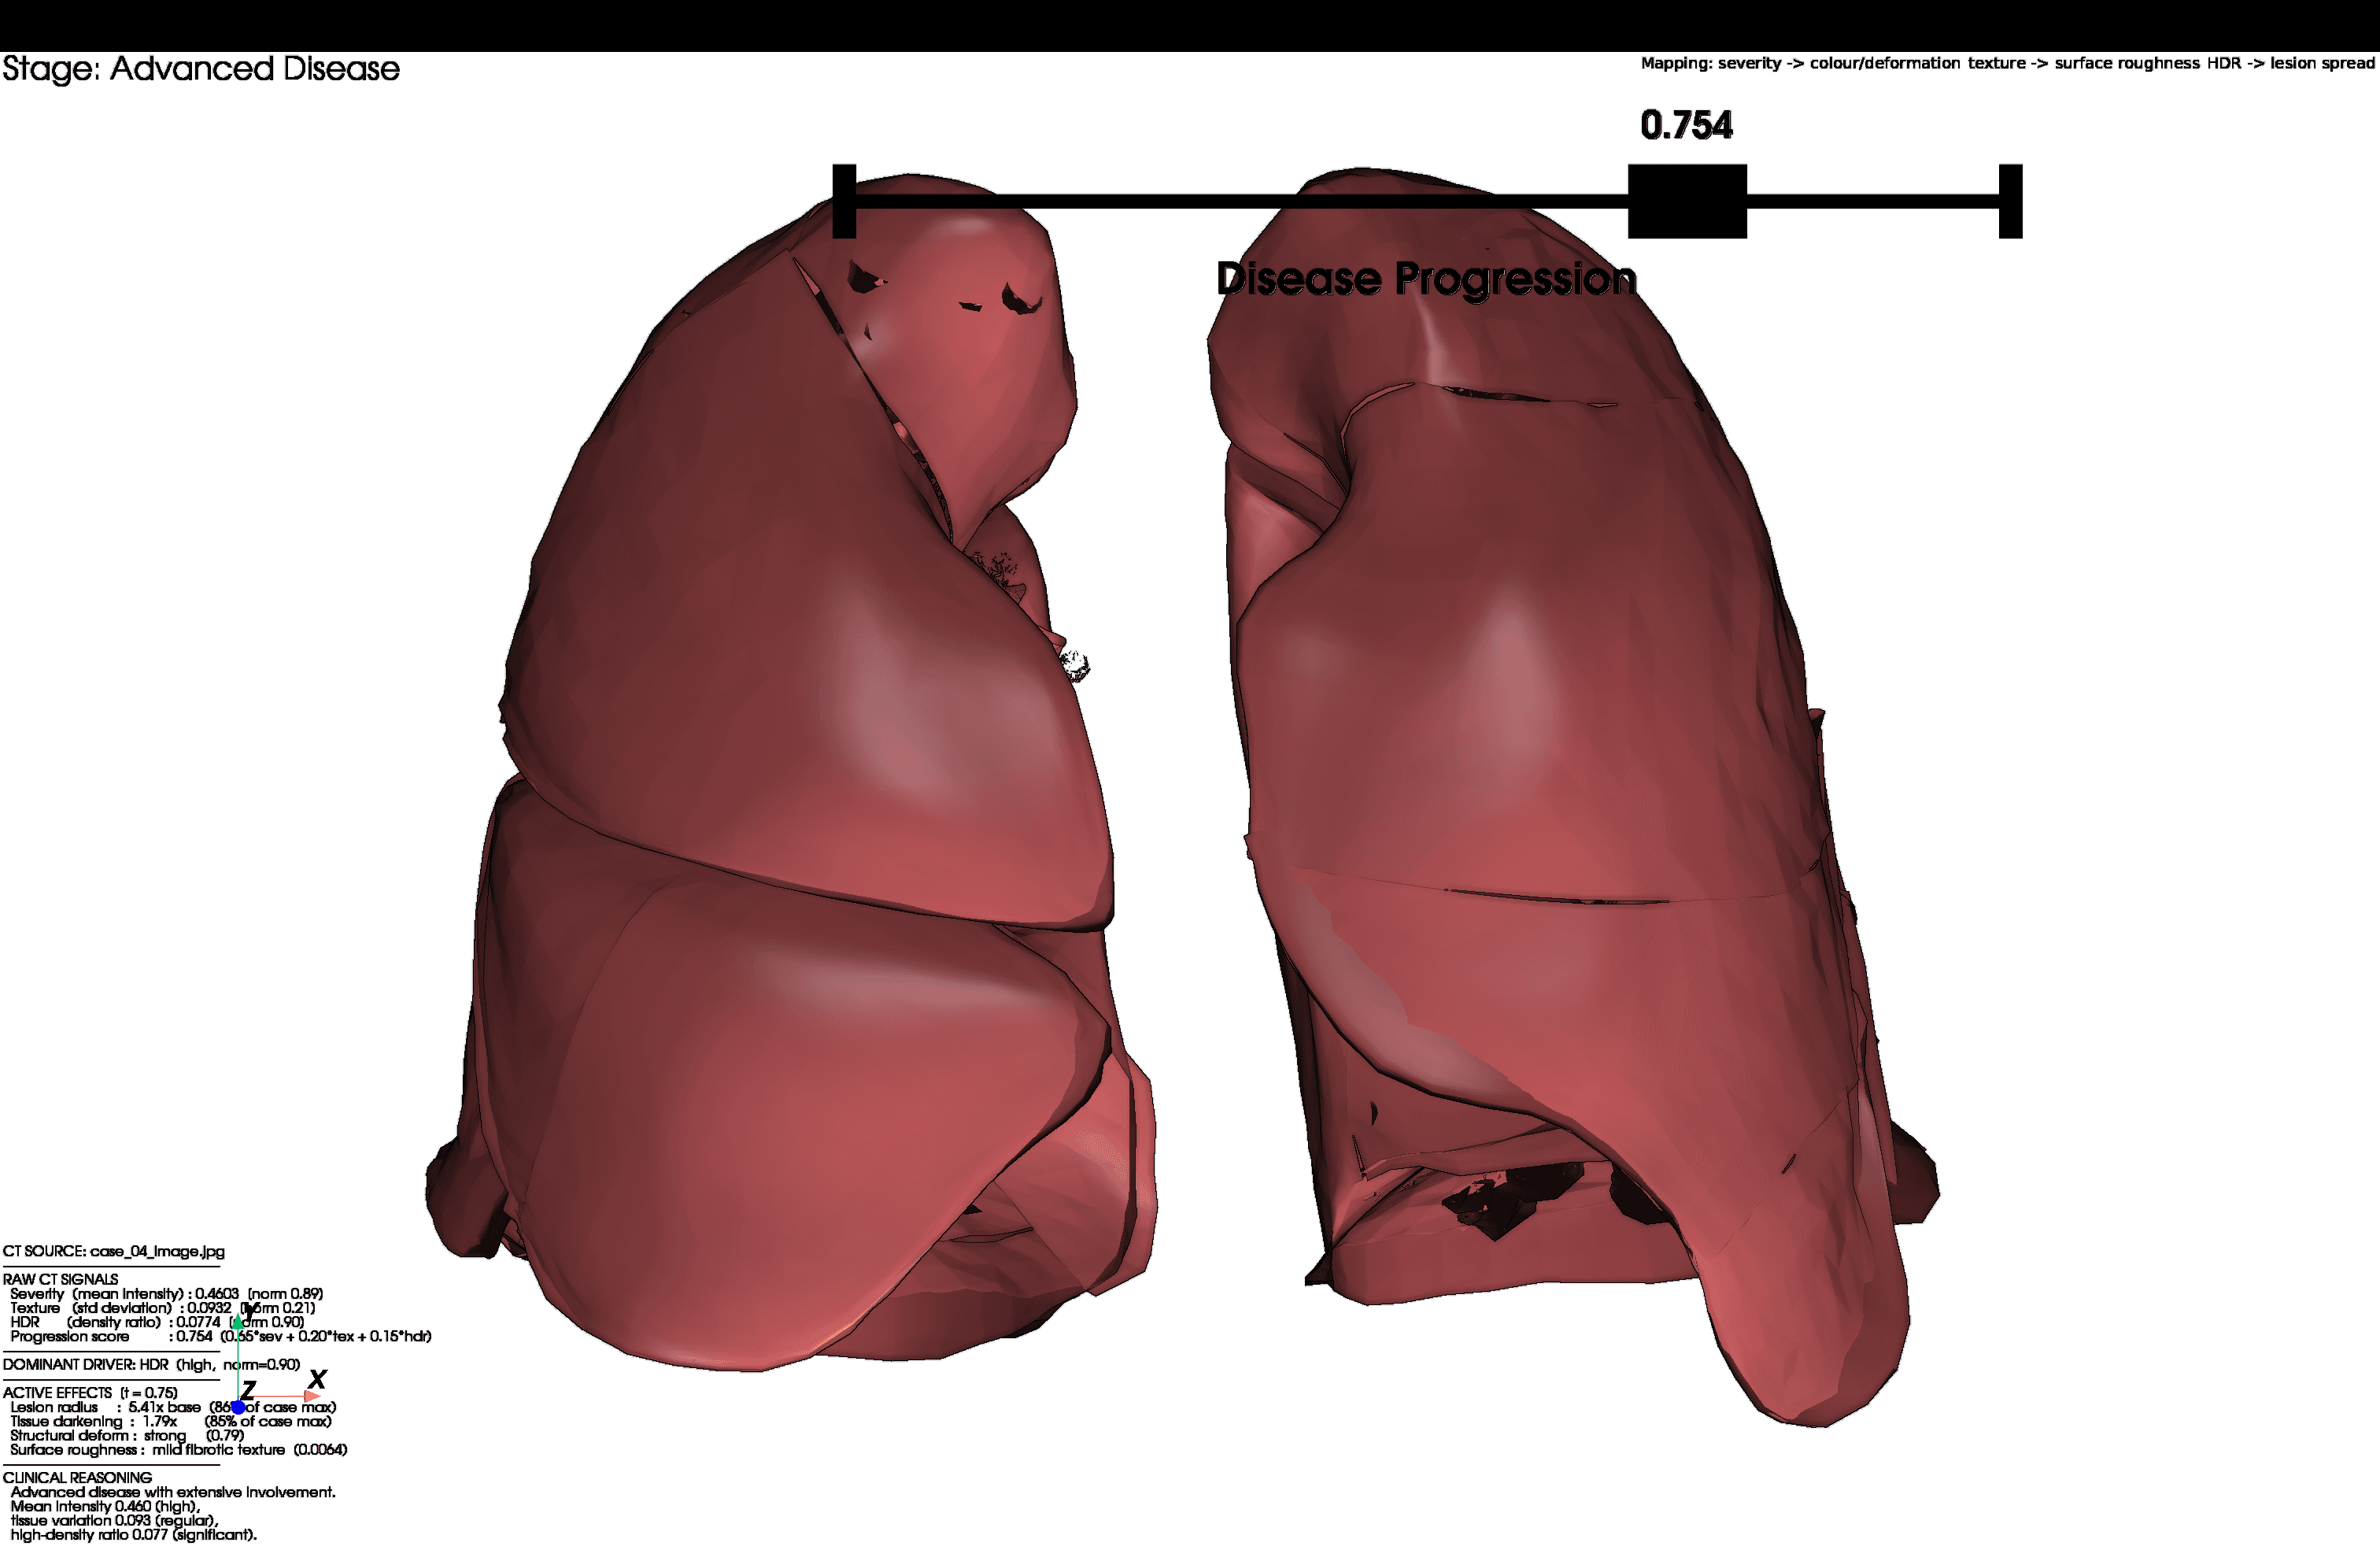
Case 04: advanced (0.754). Strong deformation and darkening, HDR the dominant driver. - Fig. 05
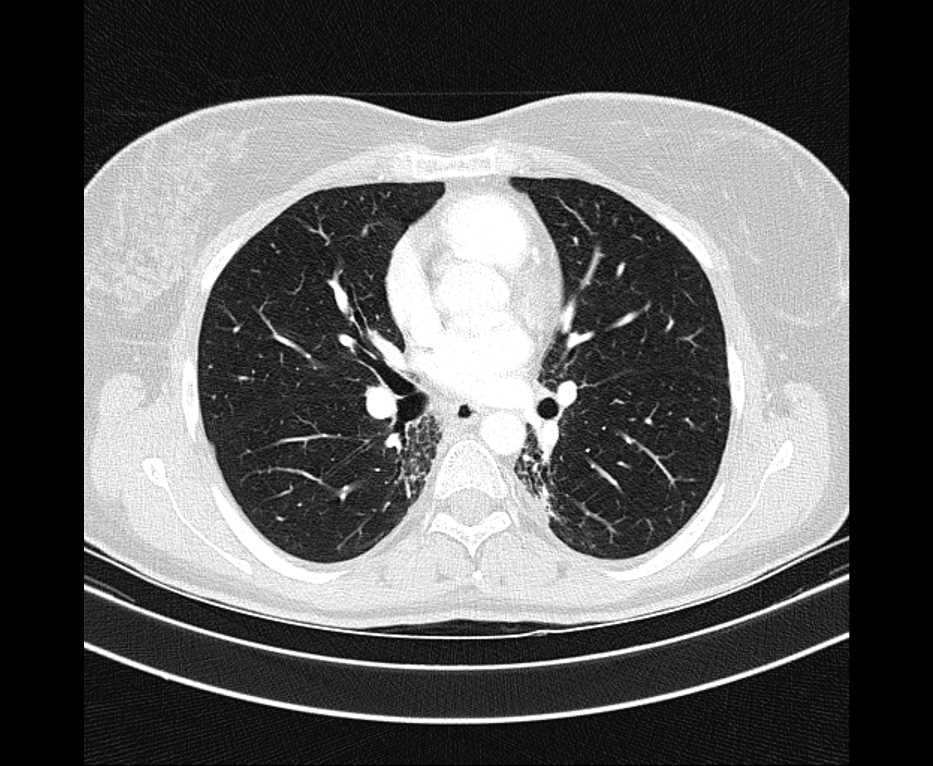
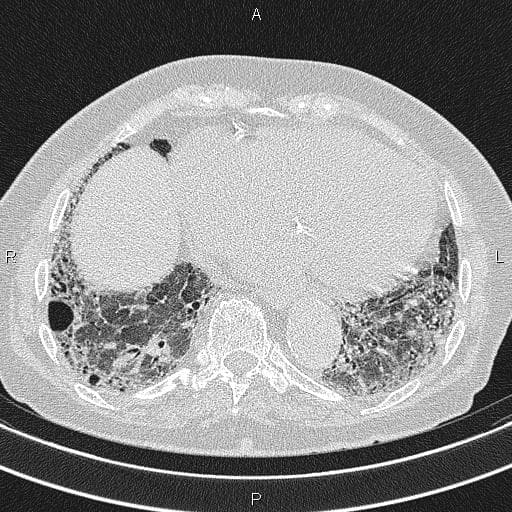
The raw CT input for Case 08: clear lung fields, scored near-healthy at 0.218.
- Python
- OpenCV
- PyVista
- Trimesh
- NumPy
Have a similar problem to solve?Let's talk it through.
I'm looking for a junior data analyst or analytics engineer role in Sydney. If something here looks like the work you need doing, get in touch.
Open to opportunitiesSydney, Australia